5.3.14. xyz-mesh distribution source
By specifying s-type = 22, a complex spatial distribution of sources can be set. The spatial distribution can be defined by x-type, y-type, and z-type subsections and the data of relative intensities \(I_{ijk}, (i=1,\cdots,n_x; j=1,\cdots,n_y; k=1,\cdots,n_z)\). The data should be written below the subsections. The direction of the sources can be specified by dir, phi, and dom. Note that the direction in each xyz-bin cannot be changed. The parameters for the xyz-mesh distribution source are shown below. The order of parameters is free except for the data of the relative intensities. Parameters with (D=***) are optional.
value |
explanation |
Only xyz can be specified. |
value |
explanation |
(D=1.0) |
Direction cosine of the projectile relative to the z-axis. |
all |
Isotropic source. |
data |
An a-type subsection is required. |
value |
explanation |
(D=all) |
Azimuthal angle [degree]. |
all |
Randomly selected in the range from 0 to 360 degrees. |
value |
explanation |
(D=0.0) |
Solid angle spread [degree]. |
-1 |
\(\cos^2\) bias distribution. |
value |
explanation |
For mono-energy source, specify the projectile energy [MeV/n]. For an energy spectrum, use e-type = instead. |
value |
explanation |
(D=0) |
Option for representing the source distribution. |
0 |
Represent the distribution by changing the number of generated particles from each mesh. |
1 |
Represent the distribution by changing the source weight of each mesh. The source location is determined randomly from all meshes. |
2 |
Represent the distribution by changing the source weight of each mesh while generating equal numbers of sources from each mesh. |
value |
explanation |
mono-energy source |
Give the source energy [MeV/n] directly by e0. |
energy spectrum |
Specify the source energy distribution by e-type. |
For the data of relative intensities \(I_{ijk}\), when nx, ny, and nz are all positive, the data should be written as follows:
where \(n_x = |nx|\), \(n_y = |ny|\), and \(n_z = |nz|\). For example, when ny and nz are negative, the data should be written as
that is, in descending order with respect to \(k = n_z = |nz|\).
 1:   [ Source ]
 2:    s-type = 22
 3:      proj = neutron
 4:        e0 = 1.0
 5:       dir = all
 6:      mesh = xyz
 7:    x-type = 2
 8:        nx = 3
 9:      xmin = -10
10:      xmax =  10
11:    y-type = 2
12:        ny = -3
13:      ymin = -10
14:      ymax =  10
15:    z-type = 2
16:        nz = -2
17:      zmin = -10
18:      zmax =  10
19:        1 2 3
20:        4 5 6
21:        7 8 9
22:
23:        1 0 3
24:        0 5 0
25:        7 0 9
In this case, the source region is [\(-10\) cm \(\le x,y,z \le\) 10 cm], and the ranges in the \(x\), \(y\), and \(z\) axes are divided into 3, 3, and 2 bins, respectively. Because ny and nz are negative, the relative intensities \(I_{ijk}\) should be written in descending order for \(j\) and \(k\). Therefore, in lines 19-21 of the example, \(I_{ijk}\) with \(k = 2\), that is, in the region of [0 cm \(\le z \le\) 10 cm], are given as
and \(I_{ijk}\) with \(k = 1\), that is, in the region of [\(-10\) cm \(\le z \le\) 0 cm], are given in lines 23-25 as
Fig. 5.3.5 and Fig. 5.3.6 show the source distribution of the example, obtained by [t-product] with output = source. The left and right panels are results in the regions of [0 cm \(\le z \le\) 10 cm] and [\(-10\) cm \(\le z \le\) 0 cm], respectively. In the left panel, the regions of 1, 2, 3, 4, 5, 6, … correspond to \(I_{132}, I_{232}, I_{332}, I_{122}, I_{222}, I_{322}, \cdots\), respectively. As the region number increases, the intensity in each region gradually increases. In the right panel, the sources do not generate in the regions of 2, 4, 6, and 8, which correspond to the elements of 0 on the right-hand side of Eq. (5.3.1).
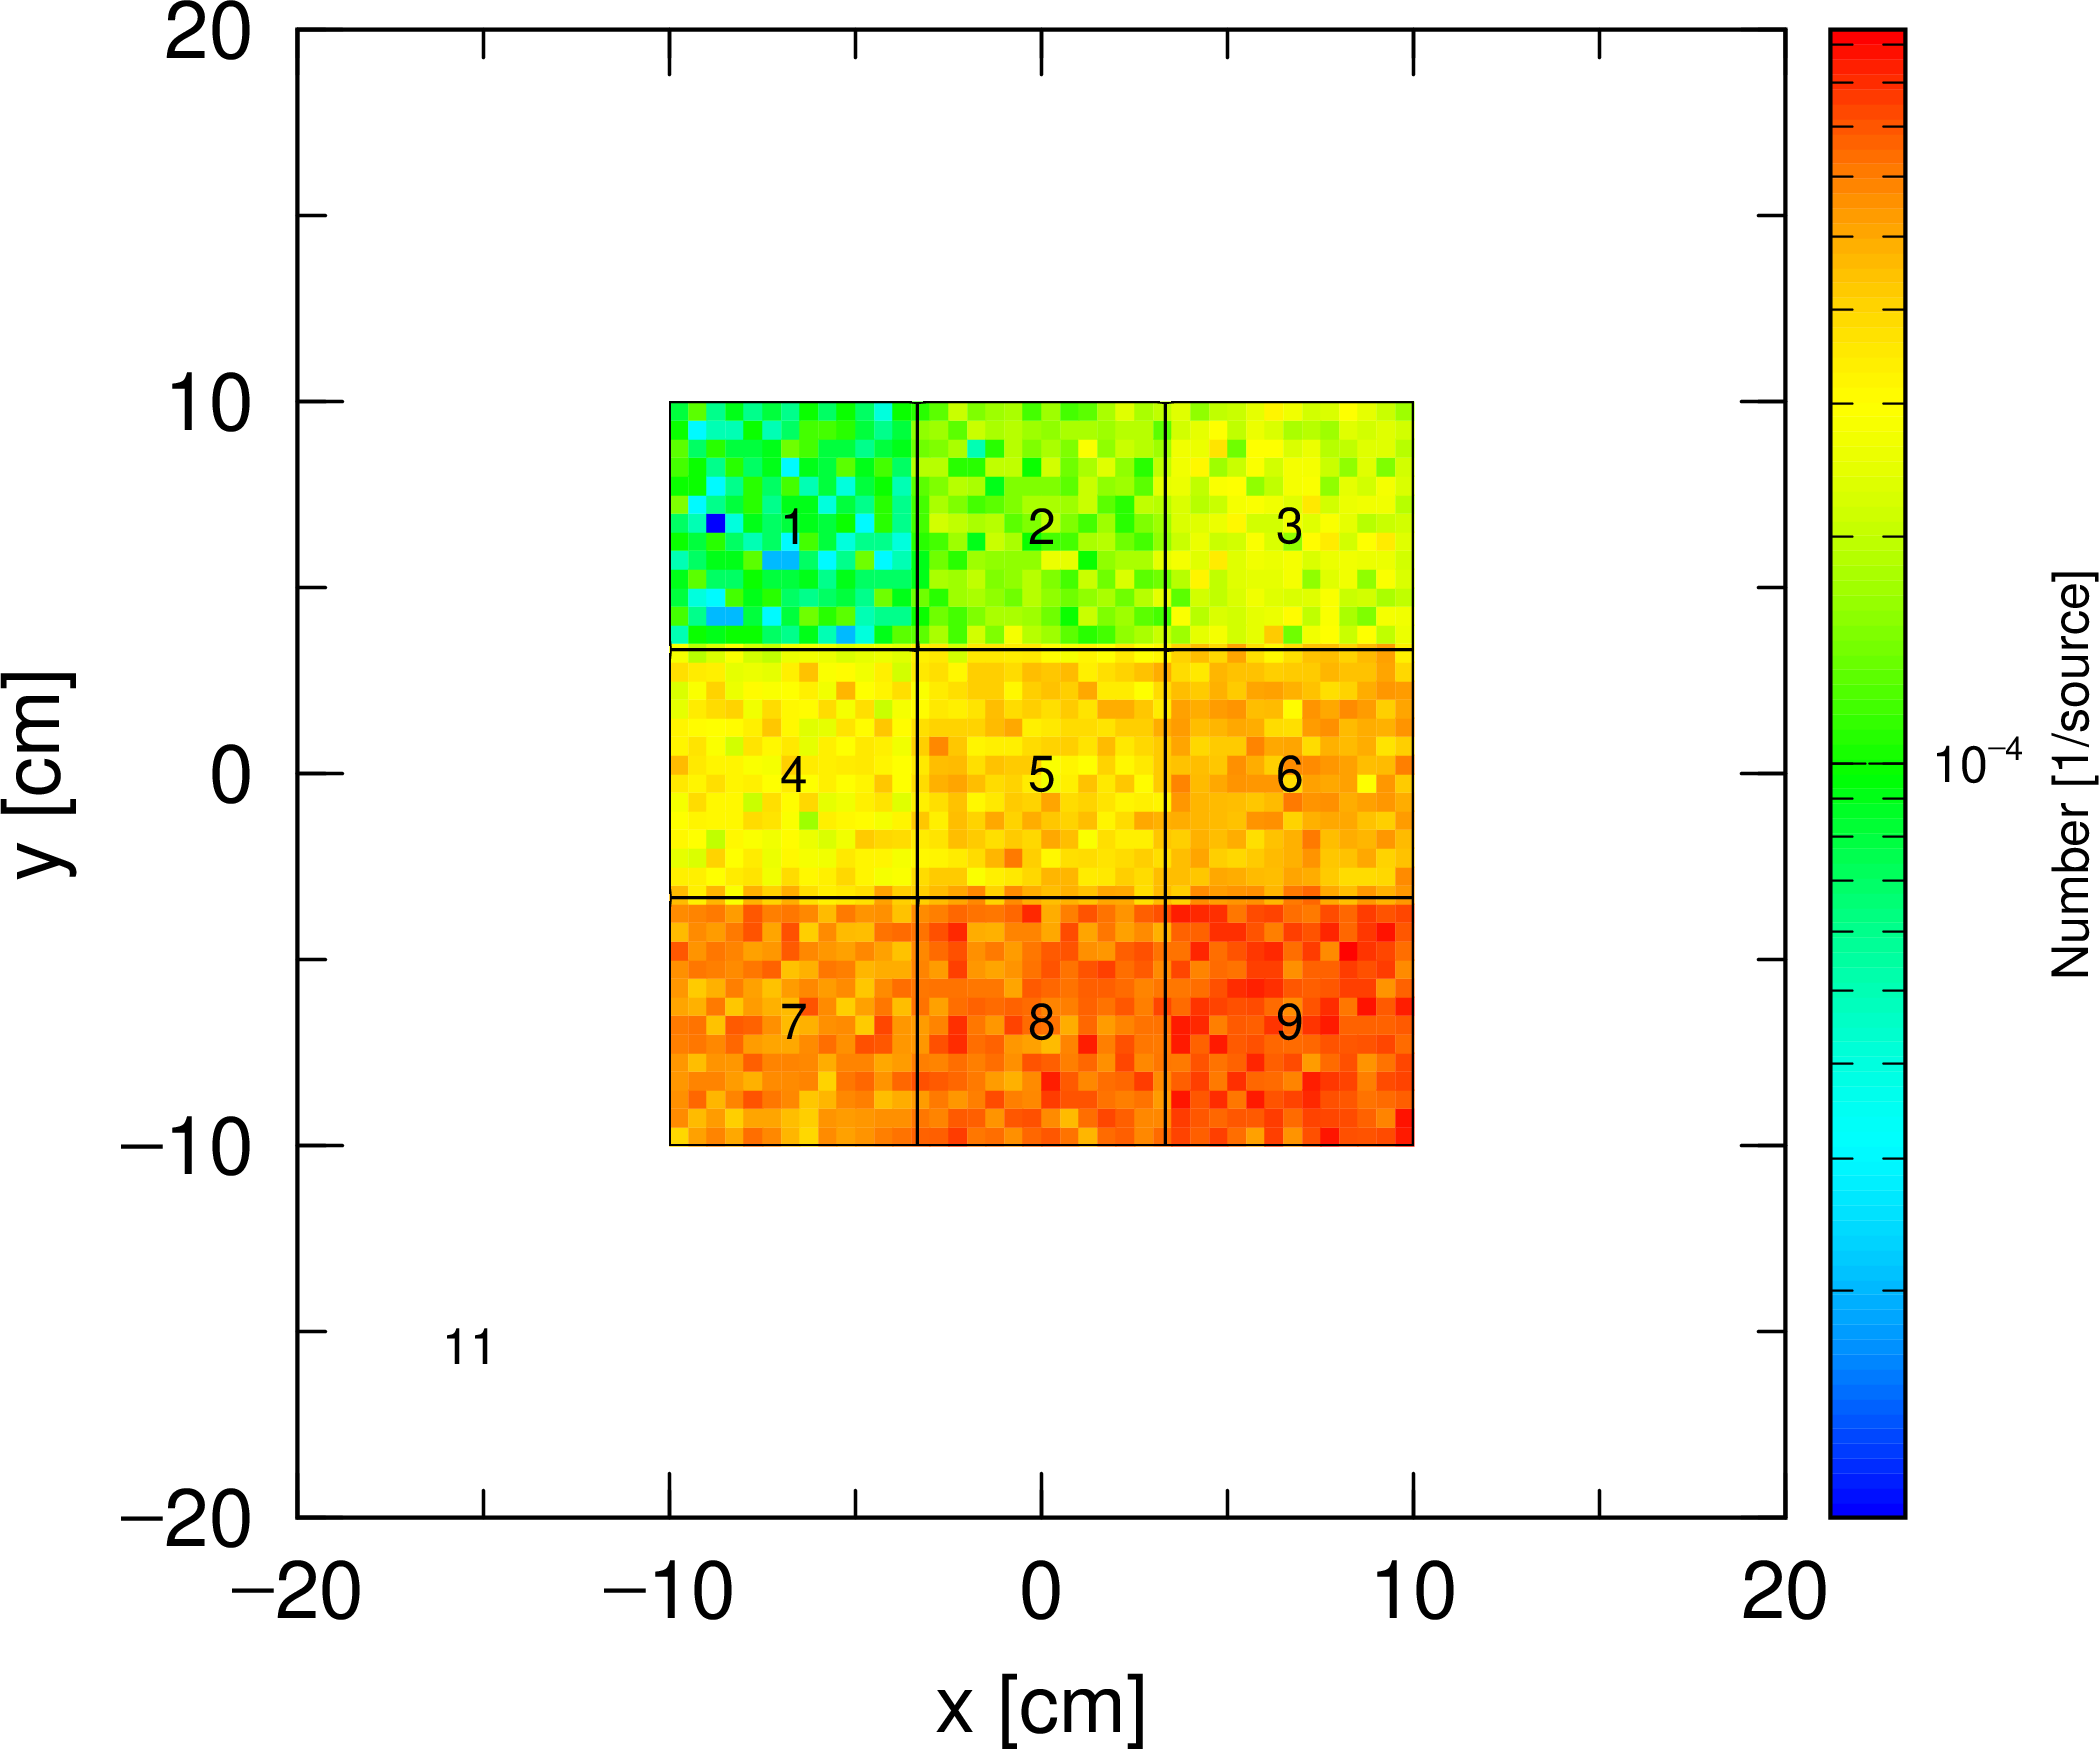
Fig. 5.3.5 Results of the example above in the region of [0 cm \(\le z \le\) 10 cm].
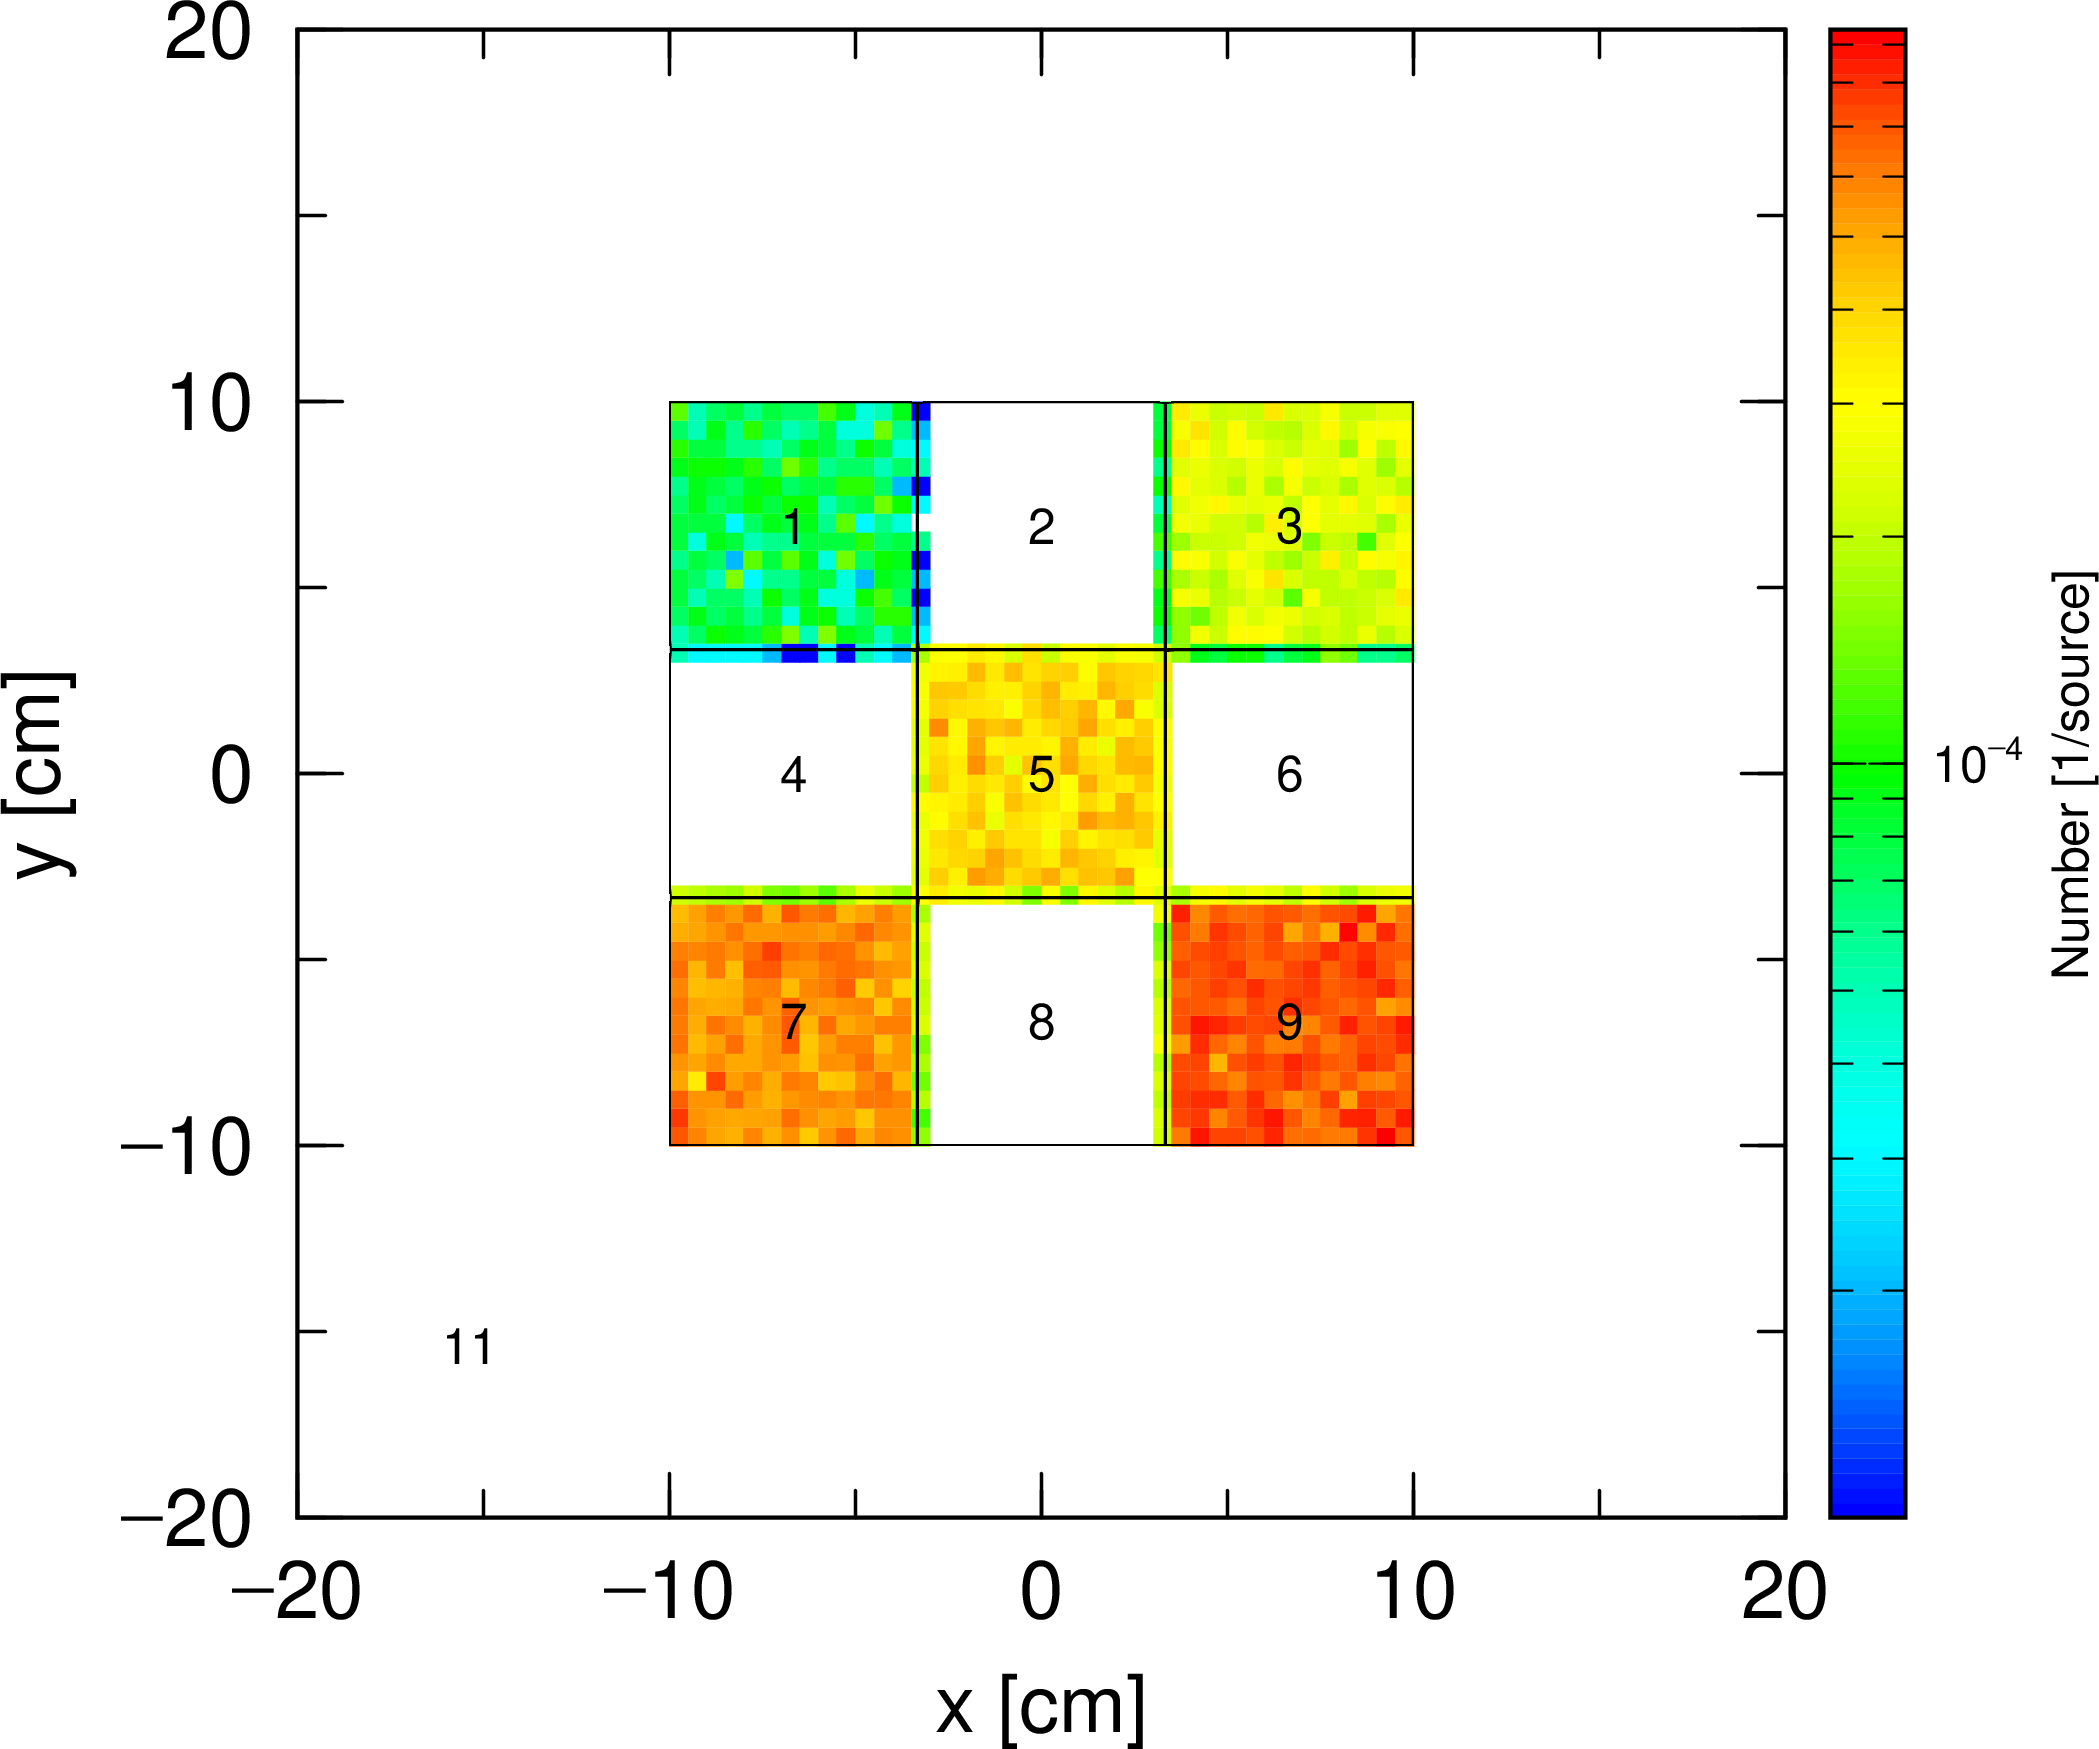
Fig. 5.3.6 Results of the example above in the region of [\(-10\) cm \(\le z \le\) 0 cm].