2.9. Page control sections
There are seven control commands for reading and page control.
2.9.1. NEWPAGE: Start new page
By this command, ANGEL finishes present page and starts a new page. All of parameters and constants are reset by this command.
2.9.2. C: N: Comment section
A line started from this strings is skipped for reading. If this appears in numeric data, this means the end of the data. You can use this command for some comments in input file.
2.9.3. Q: End mark section
After this section, nothing is read in input file.
2.9.4. QP: SKIPPAGE: Skip page section
After this section until next NEWPAGE: section, ANGEL skip everything for reading.
2.9.5. Z: Multigraph section
You can draw more than one graph frame in one paper. In this case, multigraph section started from Z: is used.
Z: XORG( \(x\) ) YORG( \(y\) )
where \(x\), \(y\) are the length in an unit of X and Y axes of the previous graph frame. It is not necessary to define the parameters XORG( \(x\) ), YORG( \(y\) ) in this multigraph section. You can define them in normal parameters section in the next graph.
When Z: section is appeared, some parameters are reset, e.g., the maximum and minimum values of axis, title of axis, parameters related to coordinate, but the design of the graph, user definition constant are kept in this next graph.
2.9.5.1. Example of multigraph
As a simple example, we draw Figure 1.1 and Figure 1.2 of CHAPTER 1 in one page. The input file of this example is shown in the following. In List2.2, the files of fig101.ang and fig102.ang are the input file of Figure 1.1 and Figure 1.2, respectively. We first draw Figure 1.1 by setting a scale to be 0.55 to include four graphs in one page. Next we draw Figure 1.2 by moving it in x-direction by 1.7 in an unit of the length of x-axis of the previous Figure 1.1. Further we draw Figure 1.1 again by moving it in y-direction by 1.5 in an unit of the length of y-axis of the previous Figure 1.2. Then we draw Figure 1.2 again b moving it in x-direction by -1.7 in an unit of the length of x-axis of the previous Figure 1.1.
List 2.2 • Input of example of multigraph
 1:  INFL: {fig101.ang}
 2:  P: SCAL(0.55)
 3:  W:(1)/S(2)
 4:  Z: XORG(1.7) YORG(0.0)
 5:  INFL: {fig102.ang}
 6:  W:(2)/S(2)
 7:  Z: XORG(0.0) YORG(1.5)
 8:  INFL: {fig101.ang}
 9:  W:(3)/S(2)
10:  Z: XORG(-1.7) YORG(0.0)
11:  INFL: {fig102.ang}
12:  W:(4)/S(2)
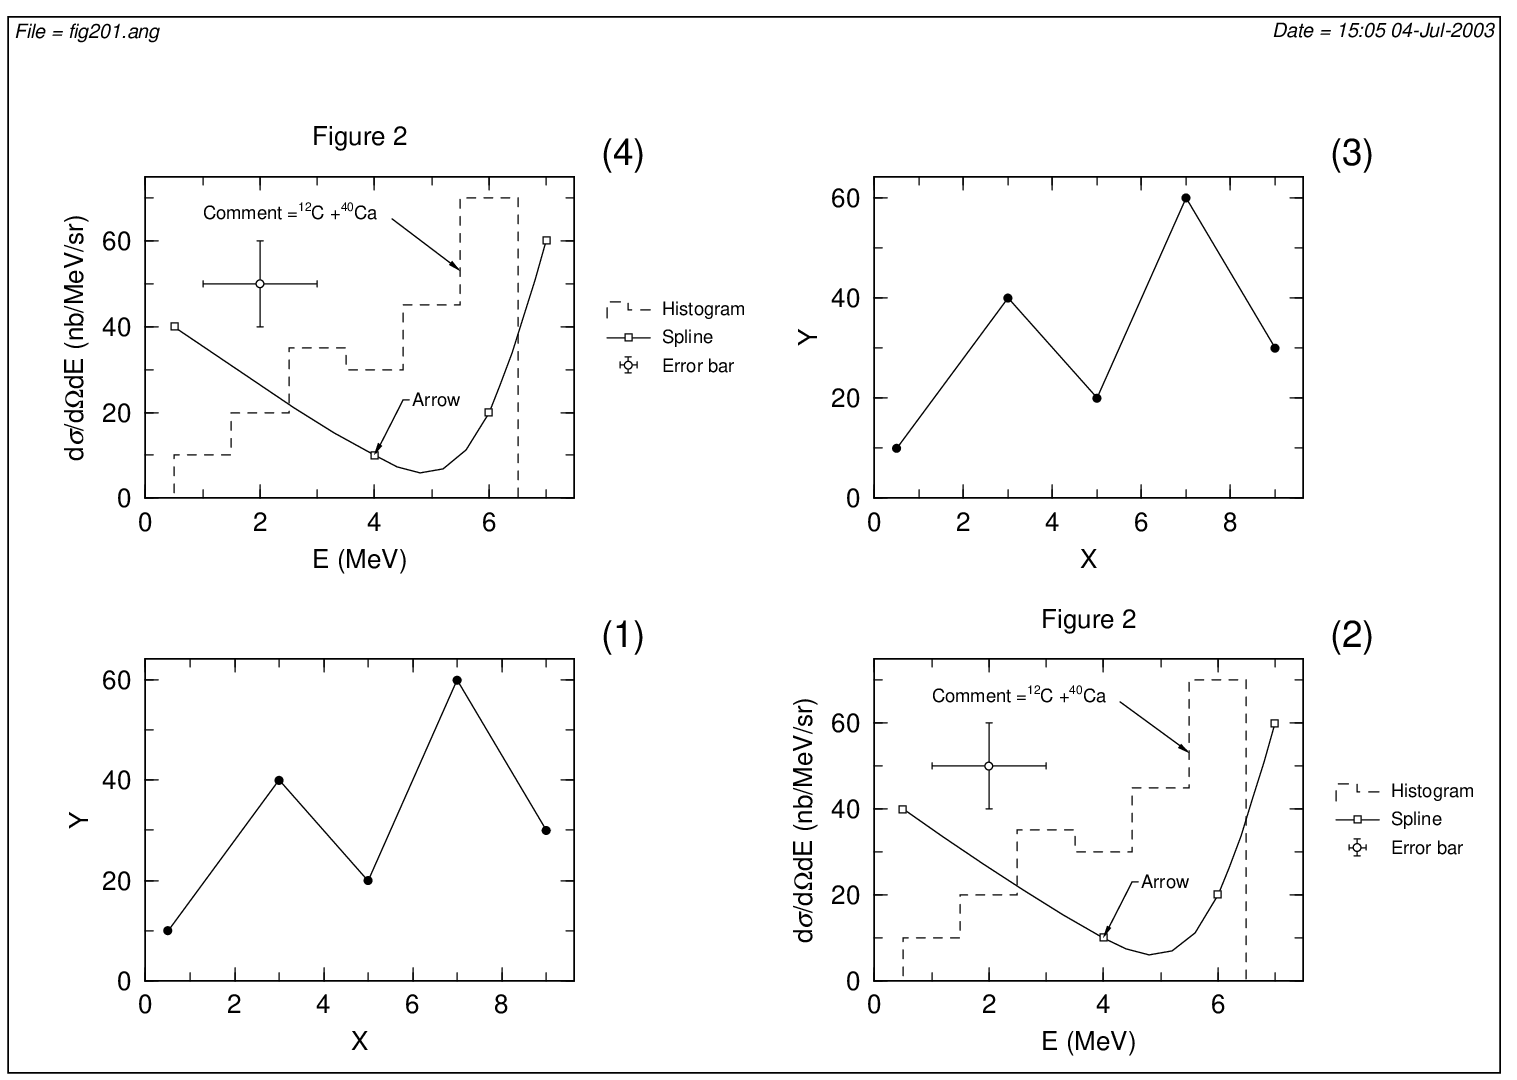
Fig. 2.2 Example of multigraph