2.18. P: Parameter section
In this parameter section, starting with P: means the definition of parameters related with the details of the graph. The parameter name is 4 characters and can include arguments. The parameter names are not case sensitive.
The parameters are explained below for each item.
2.18.1. A4 paper layout
parameter |
explanation |
|---|---|
|
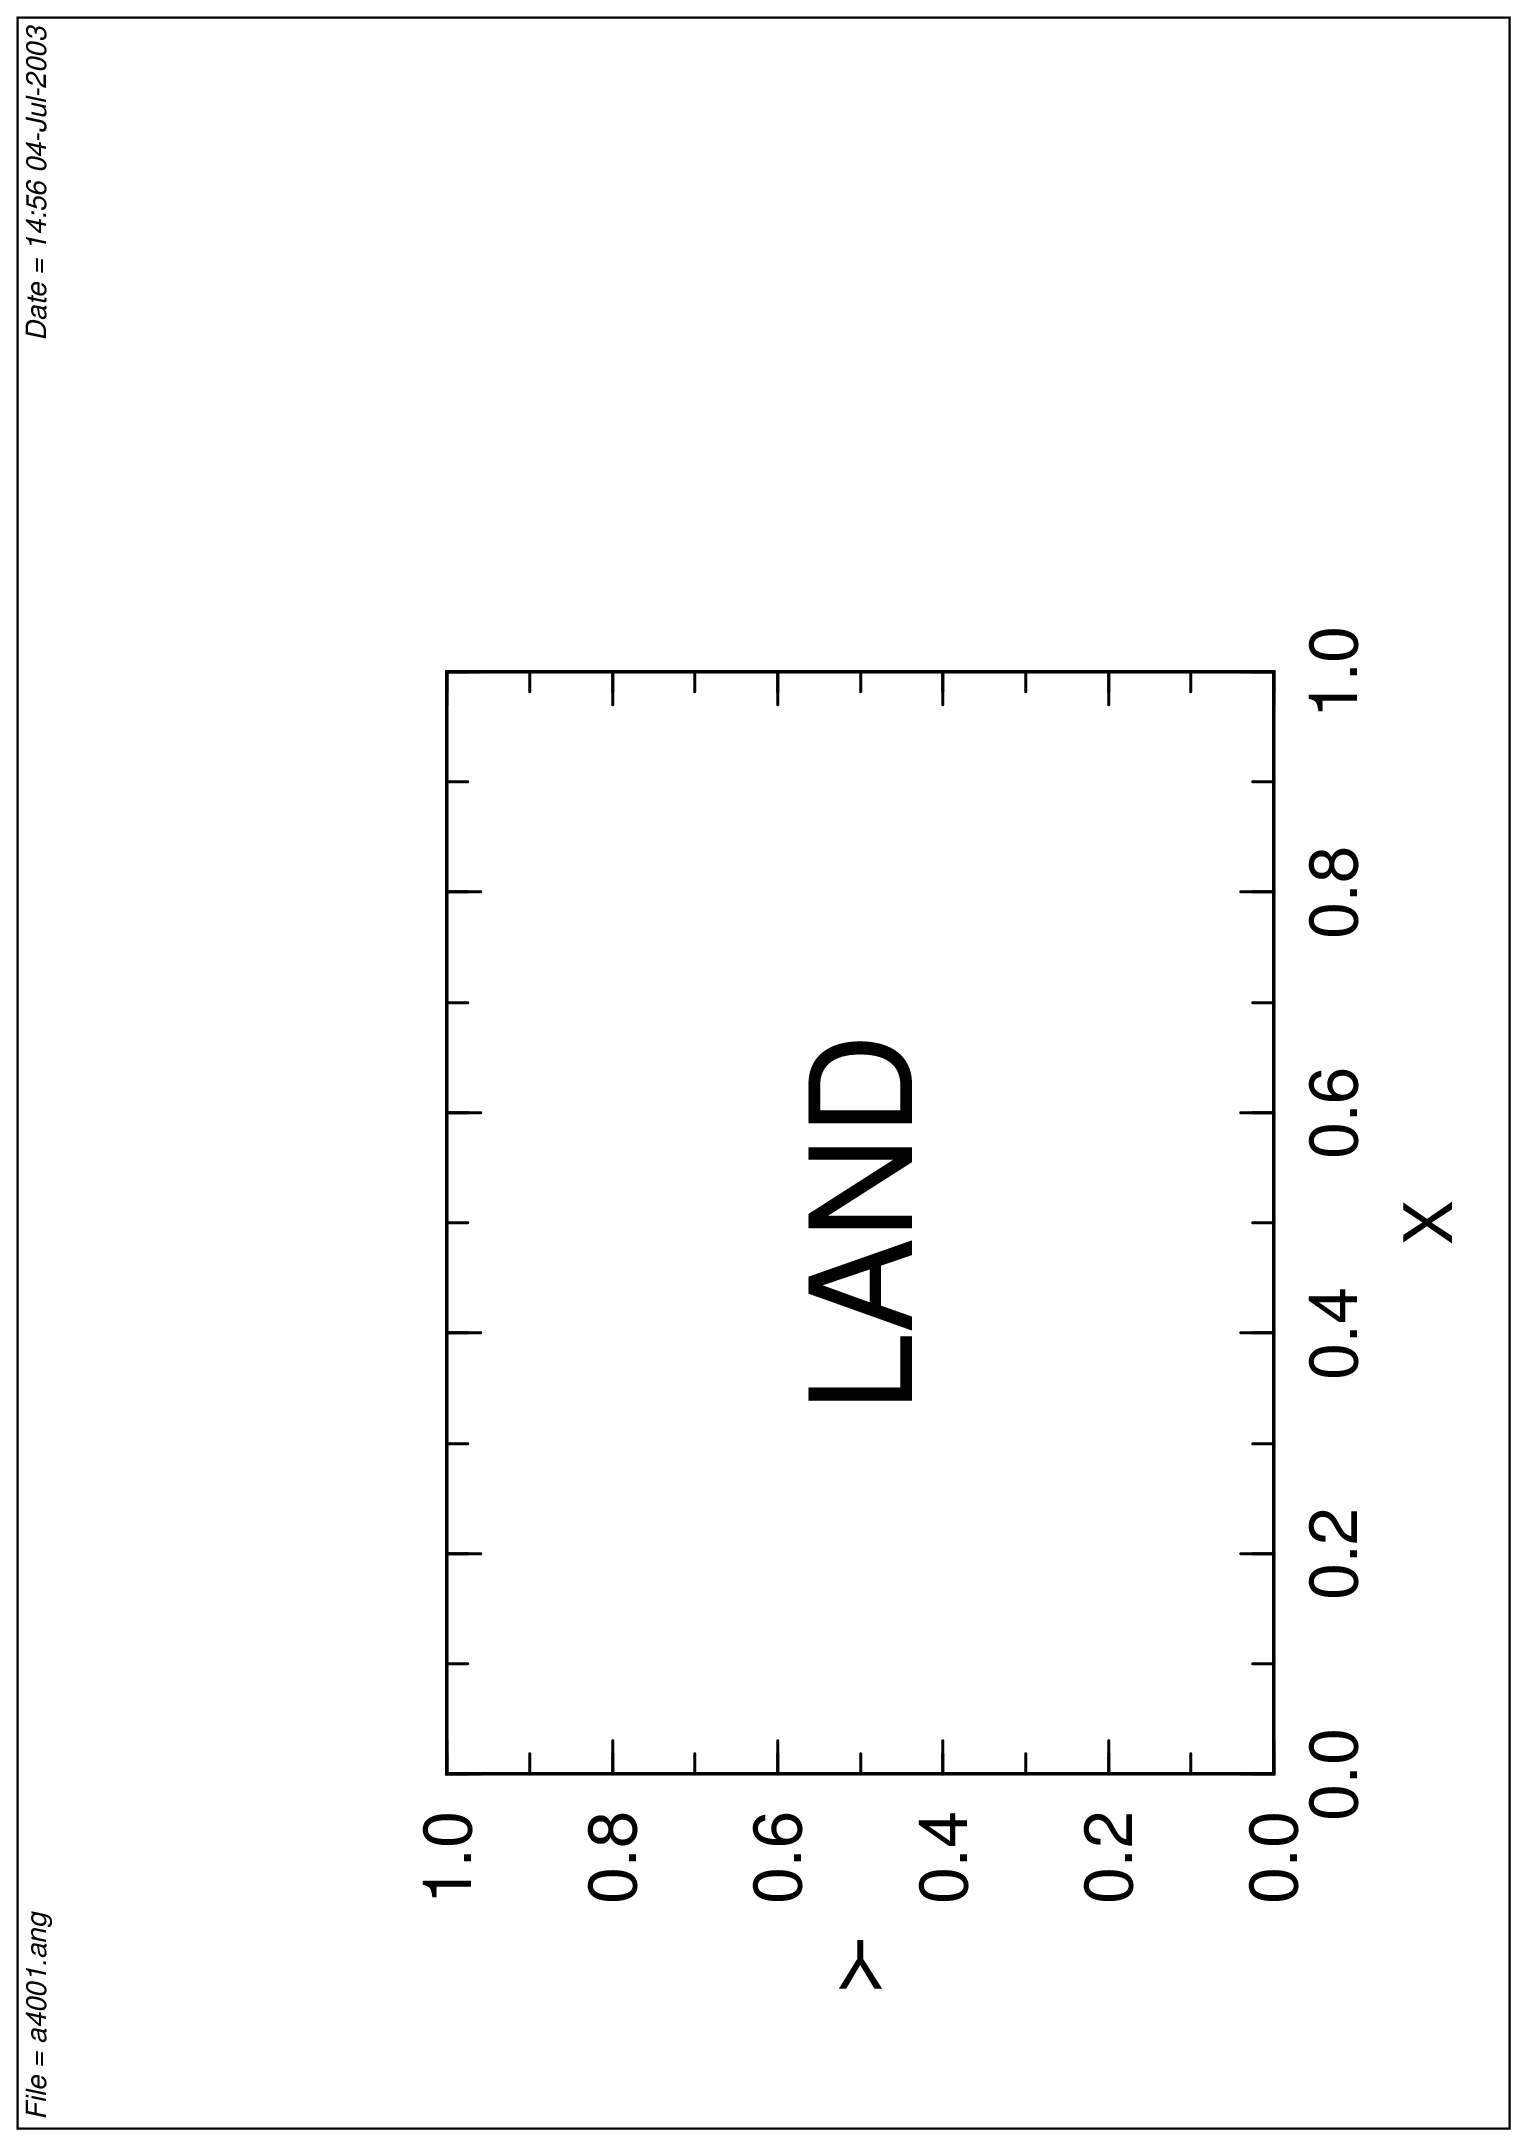
Arrange the graph horizontally in A4. (default) |
|
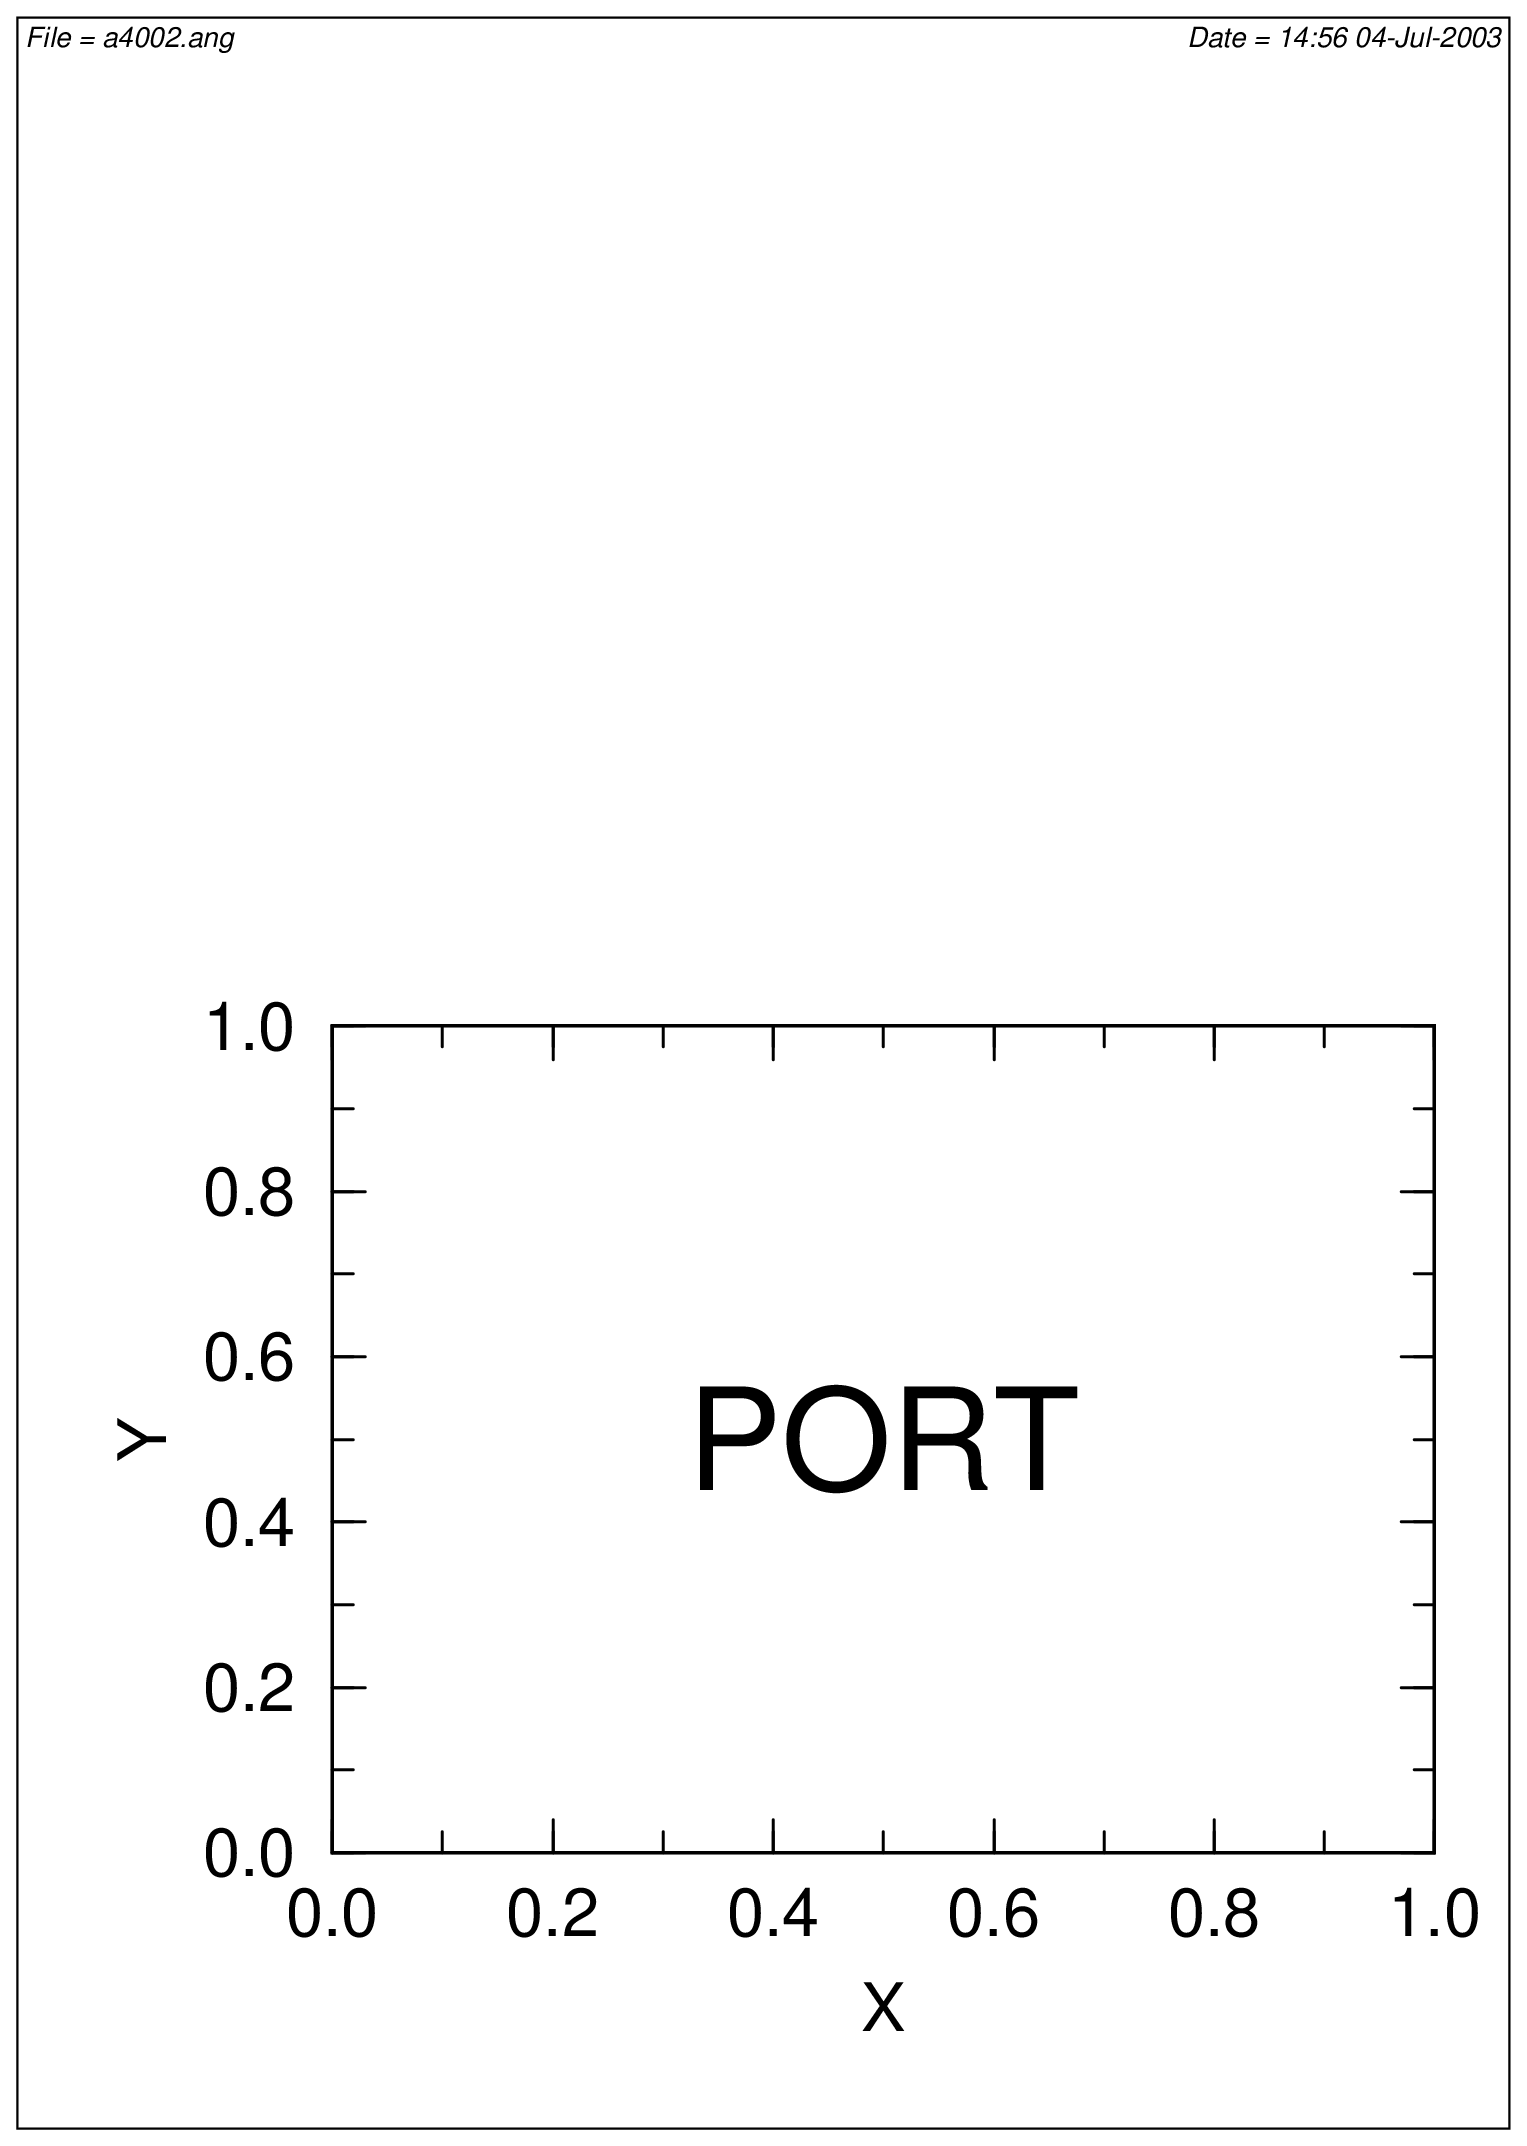
Arrange the graph vertically in A4. ( The same is true for |
|
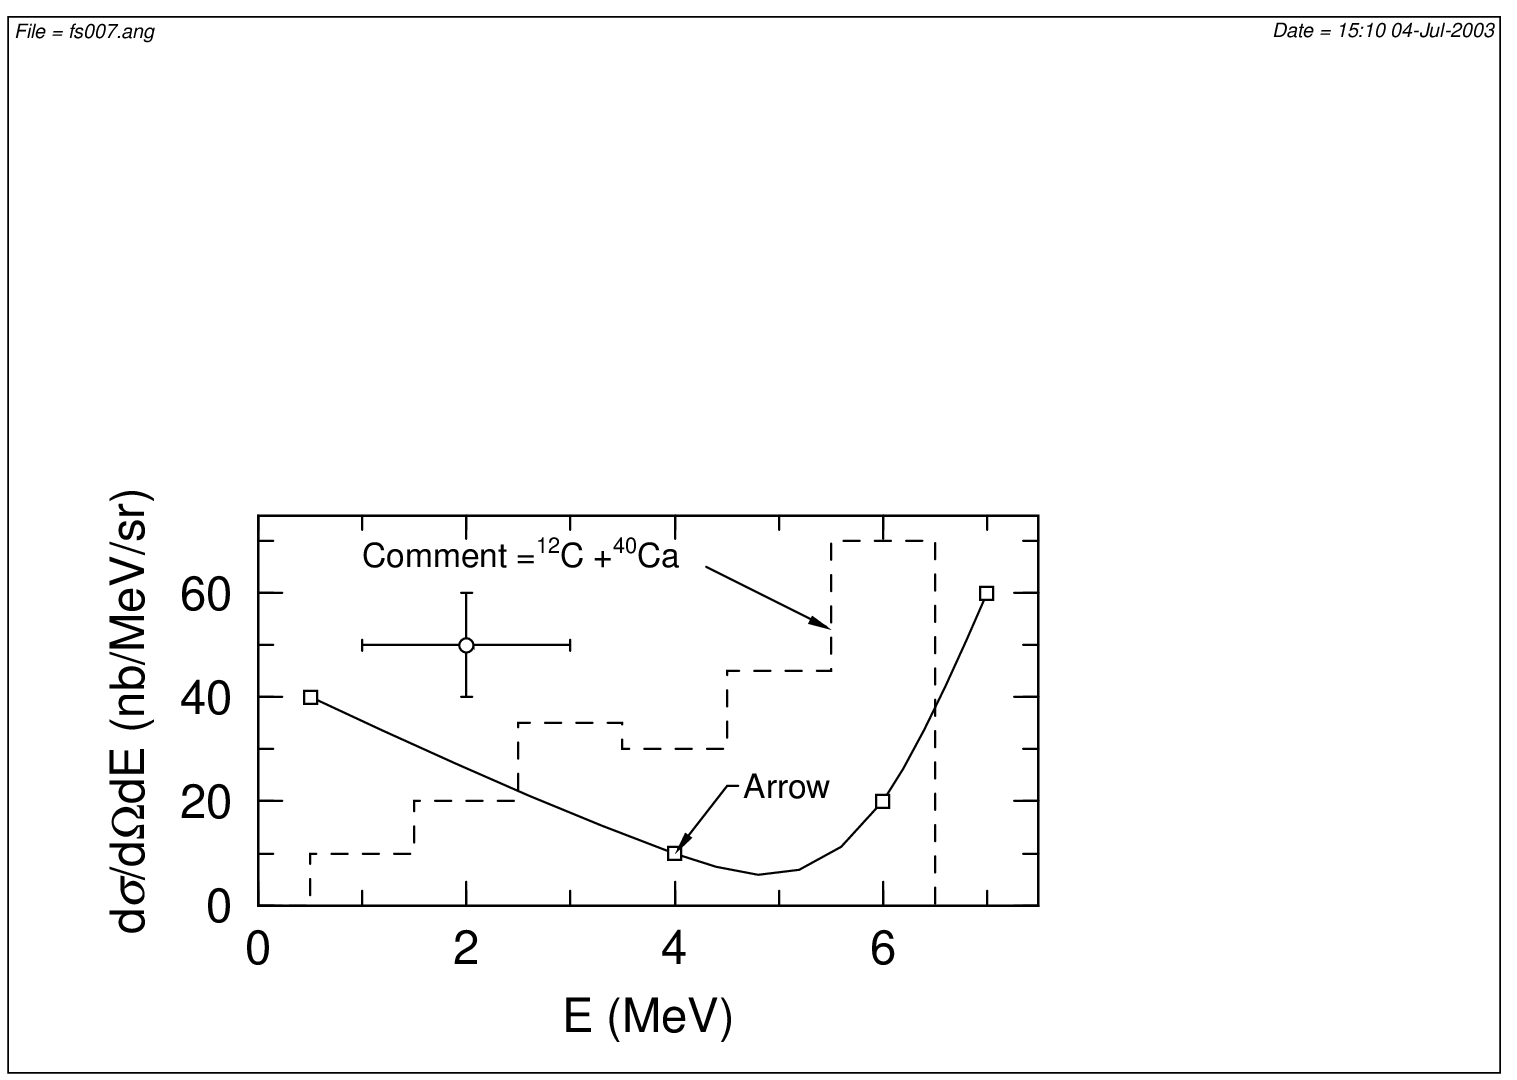
Arrange the graph by reducing the A4 horizontal LAND in half and placing it in the lower half of the A4 vertical. This is convenient when you cannot rotate when importing to LaTeX etc. |
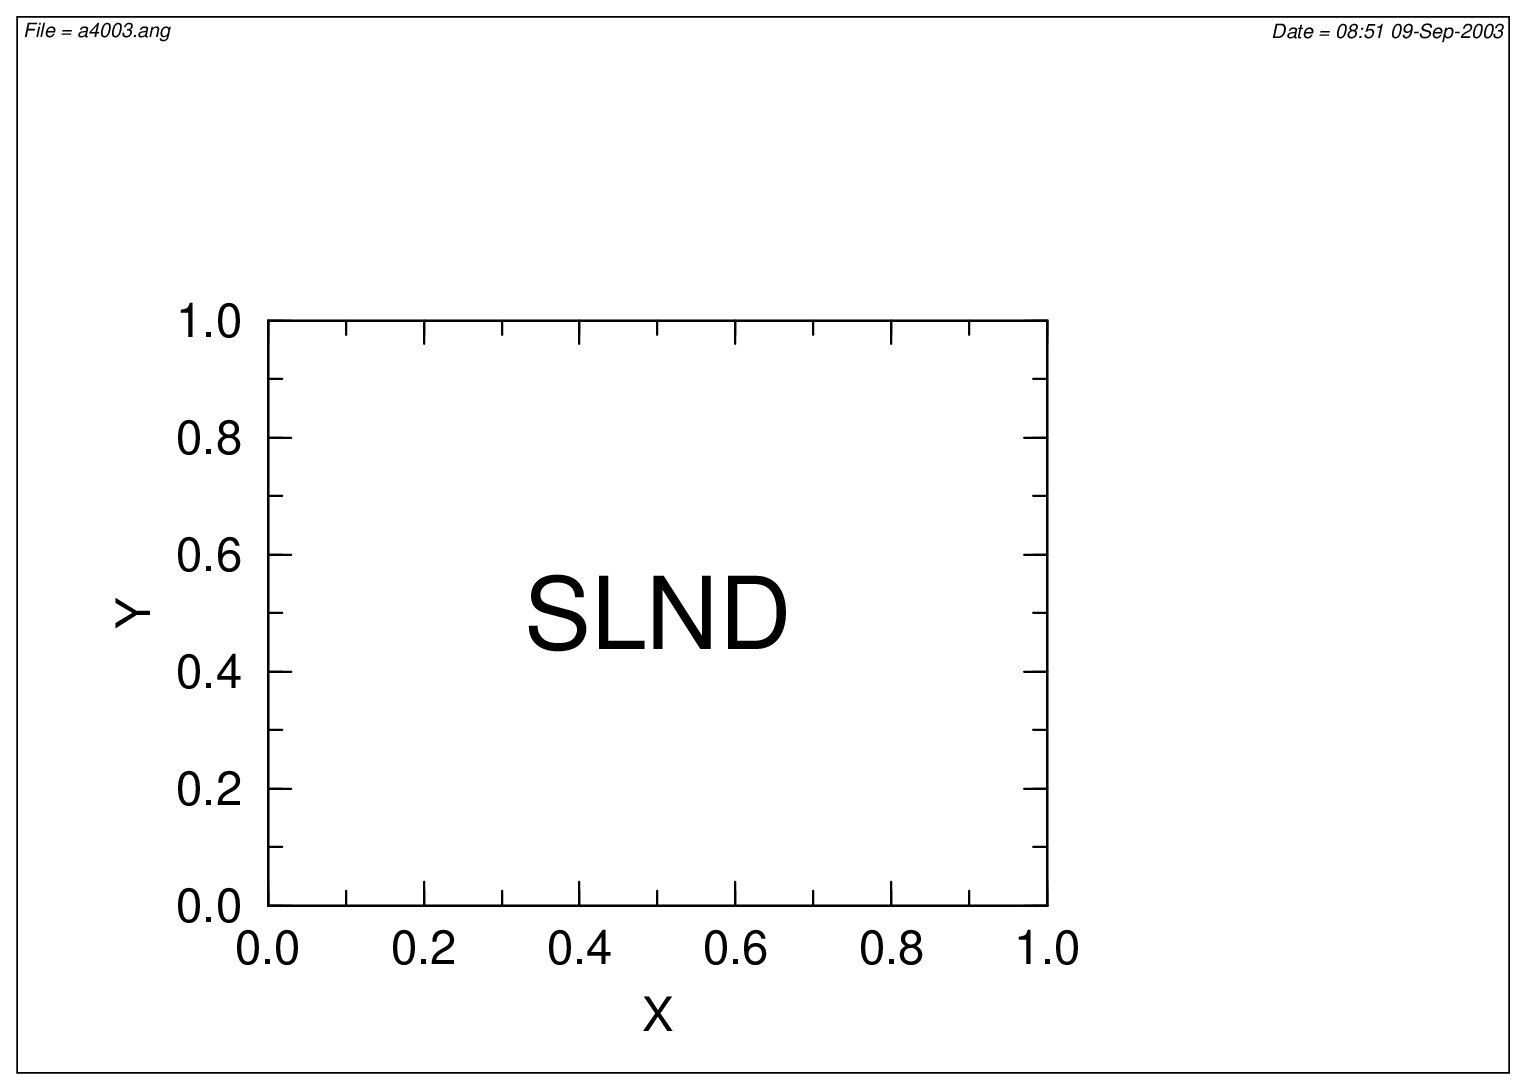
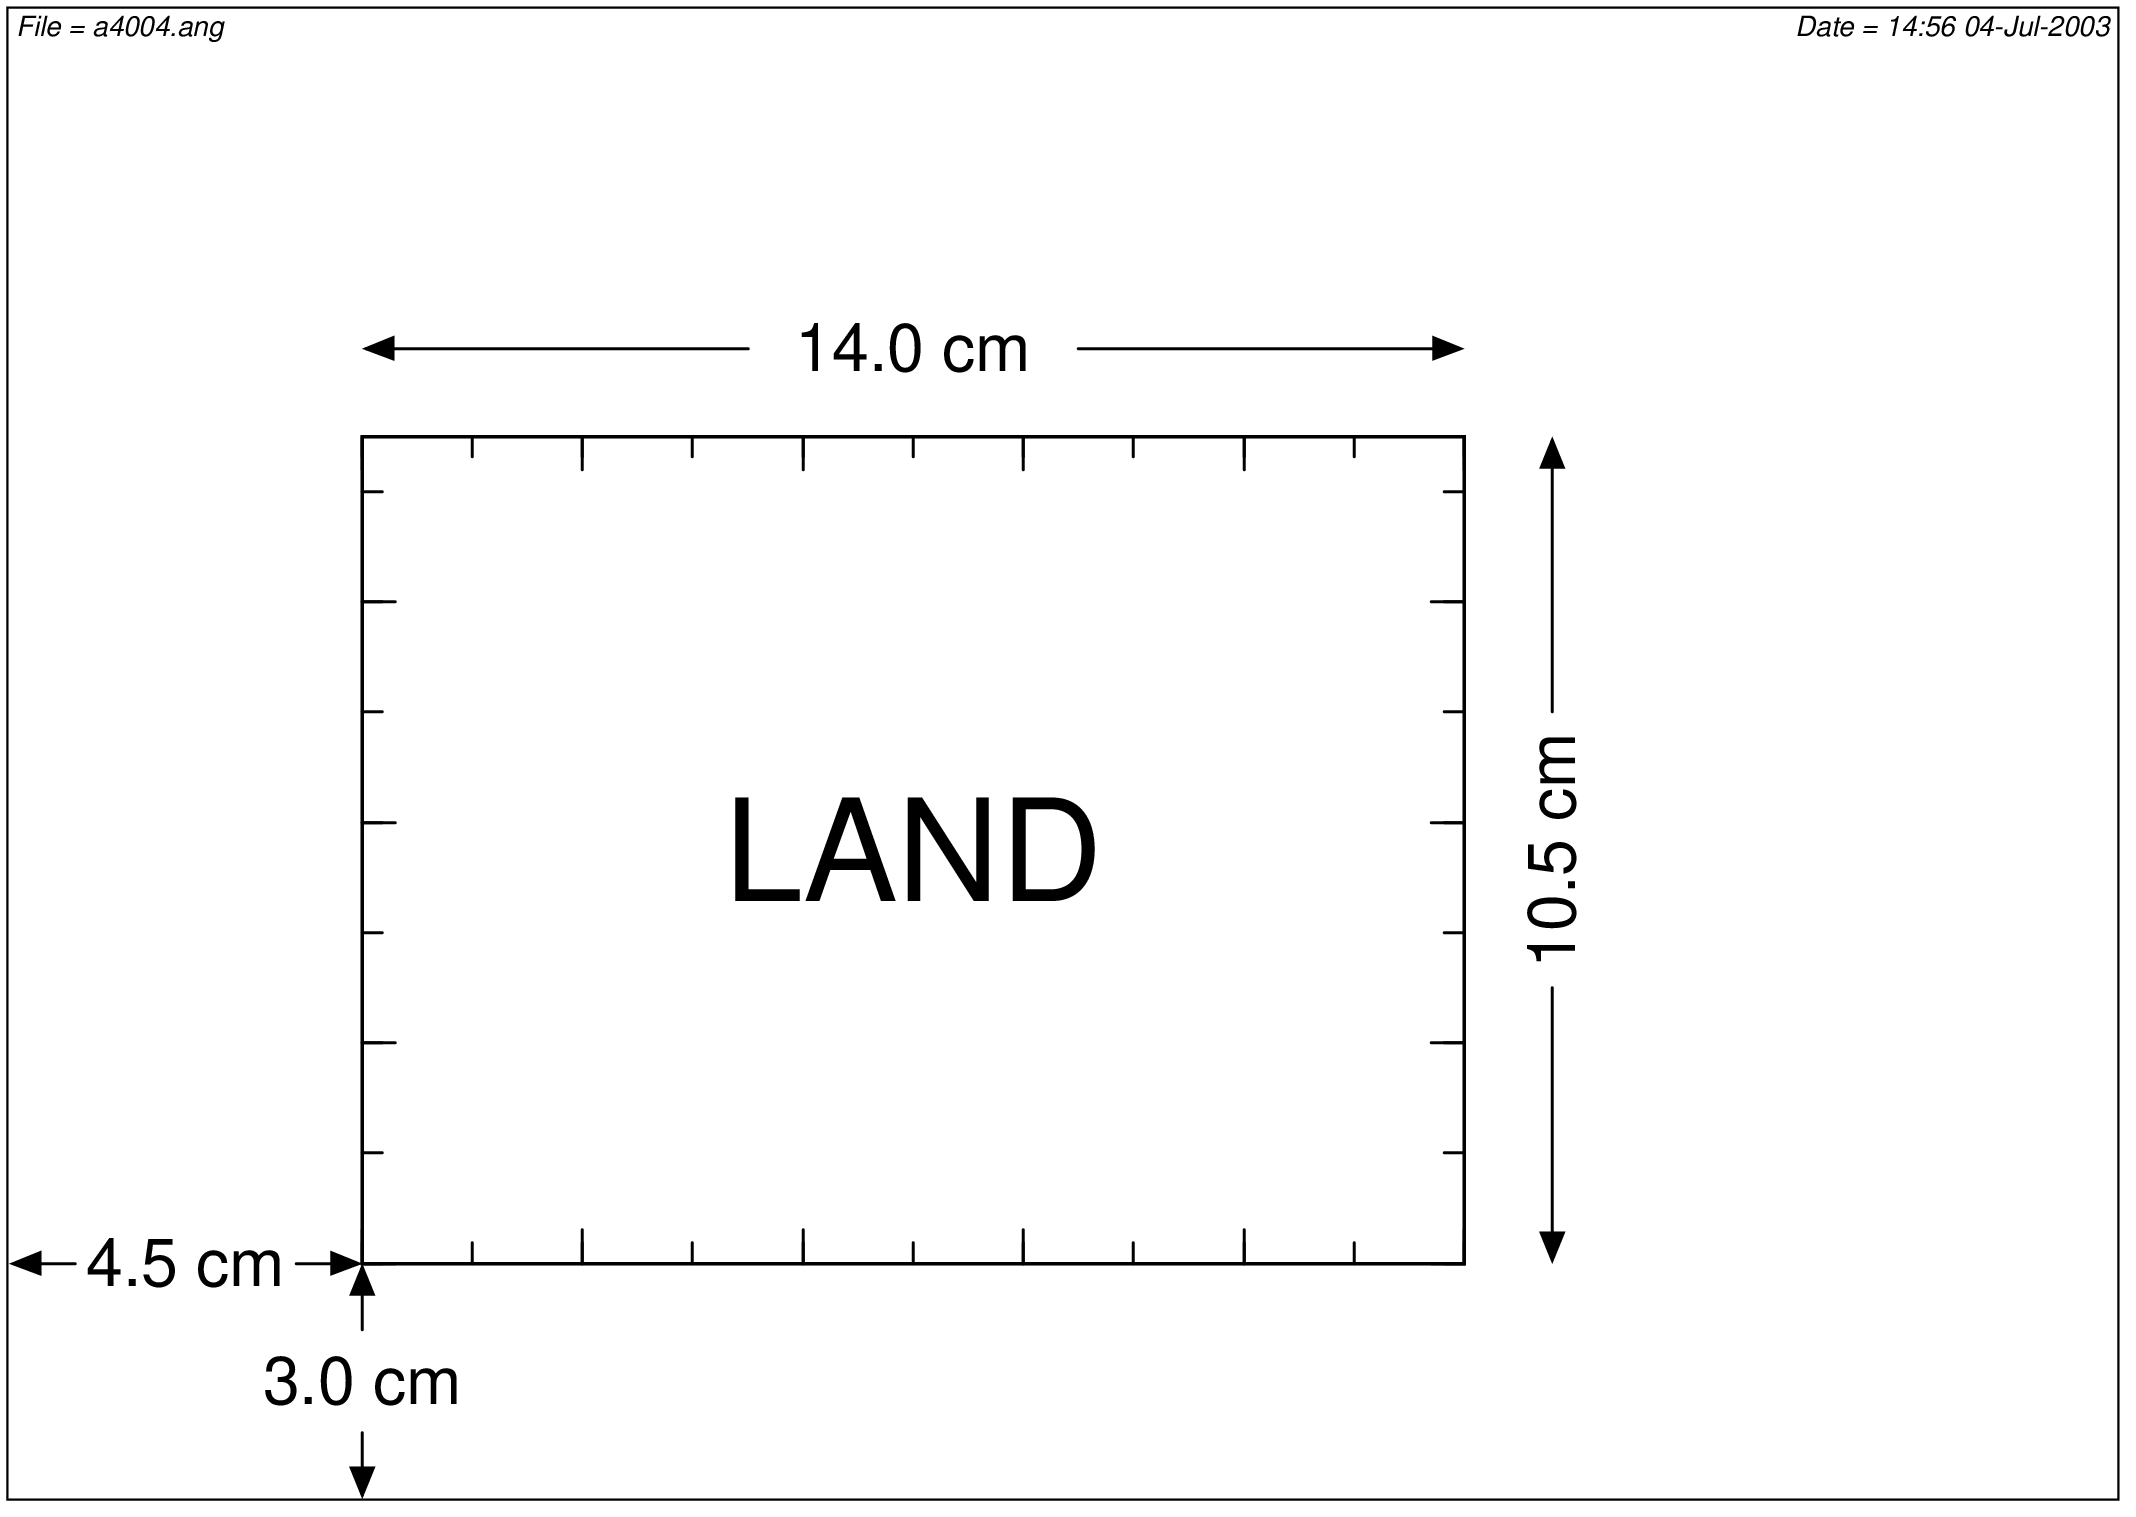
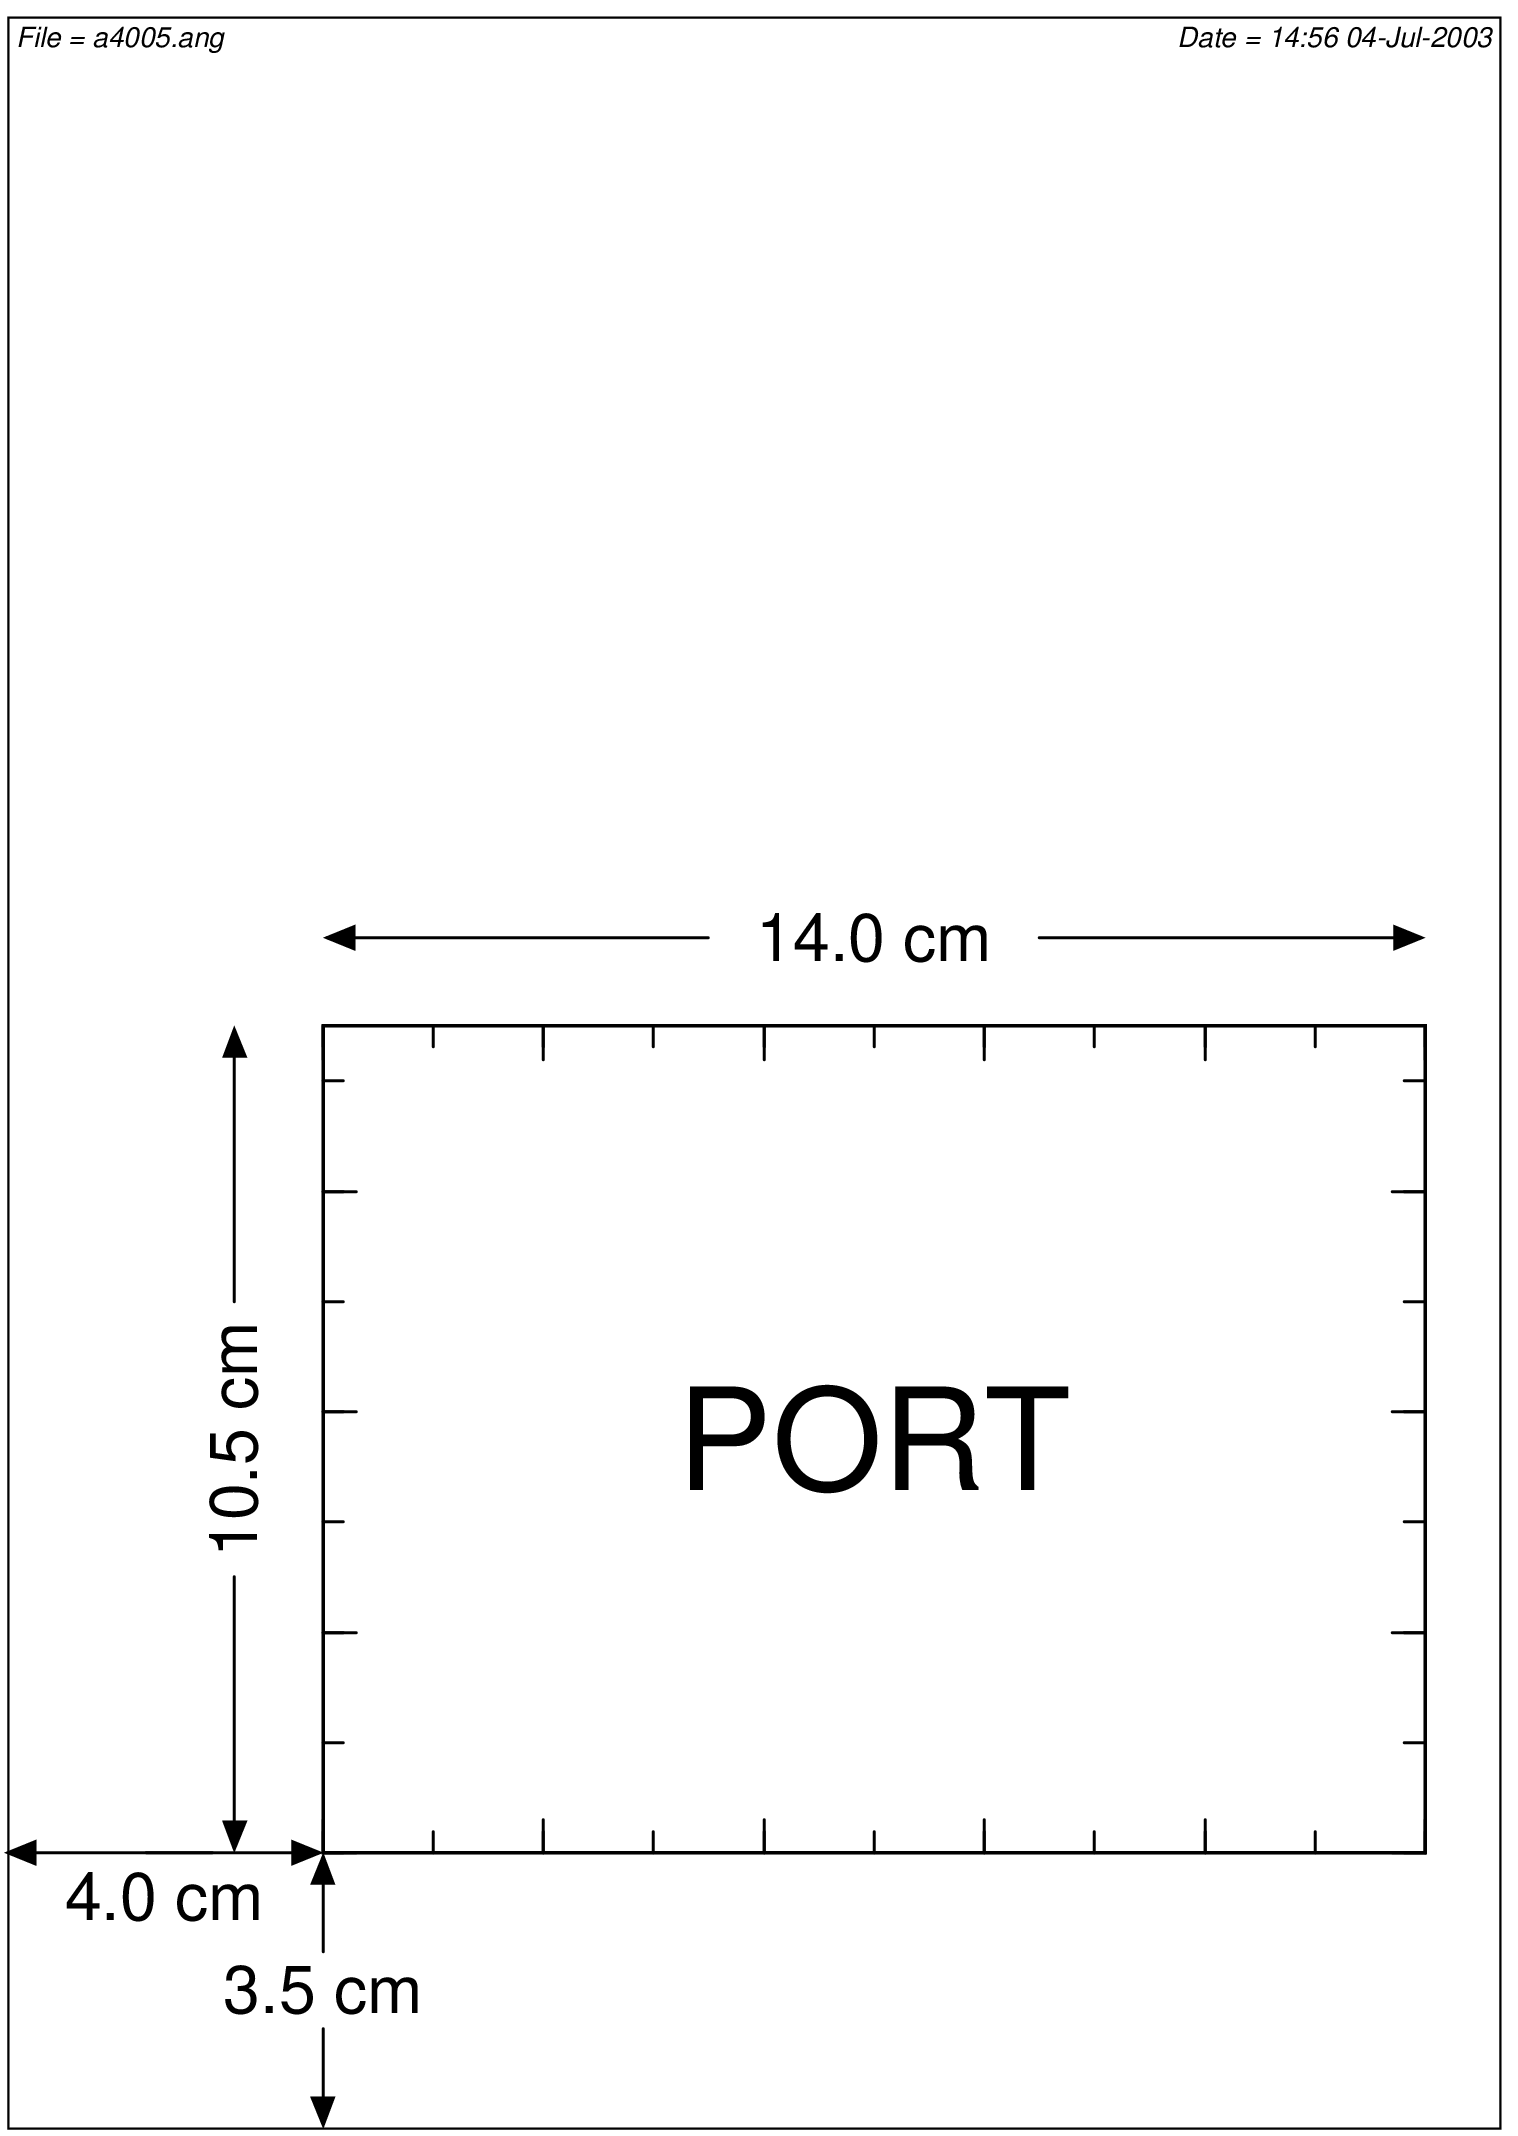
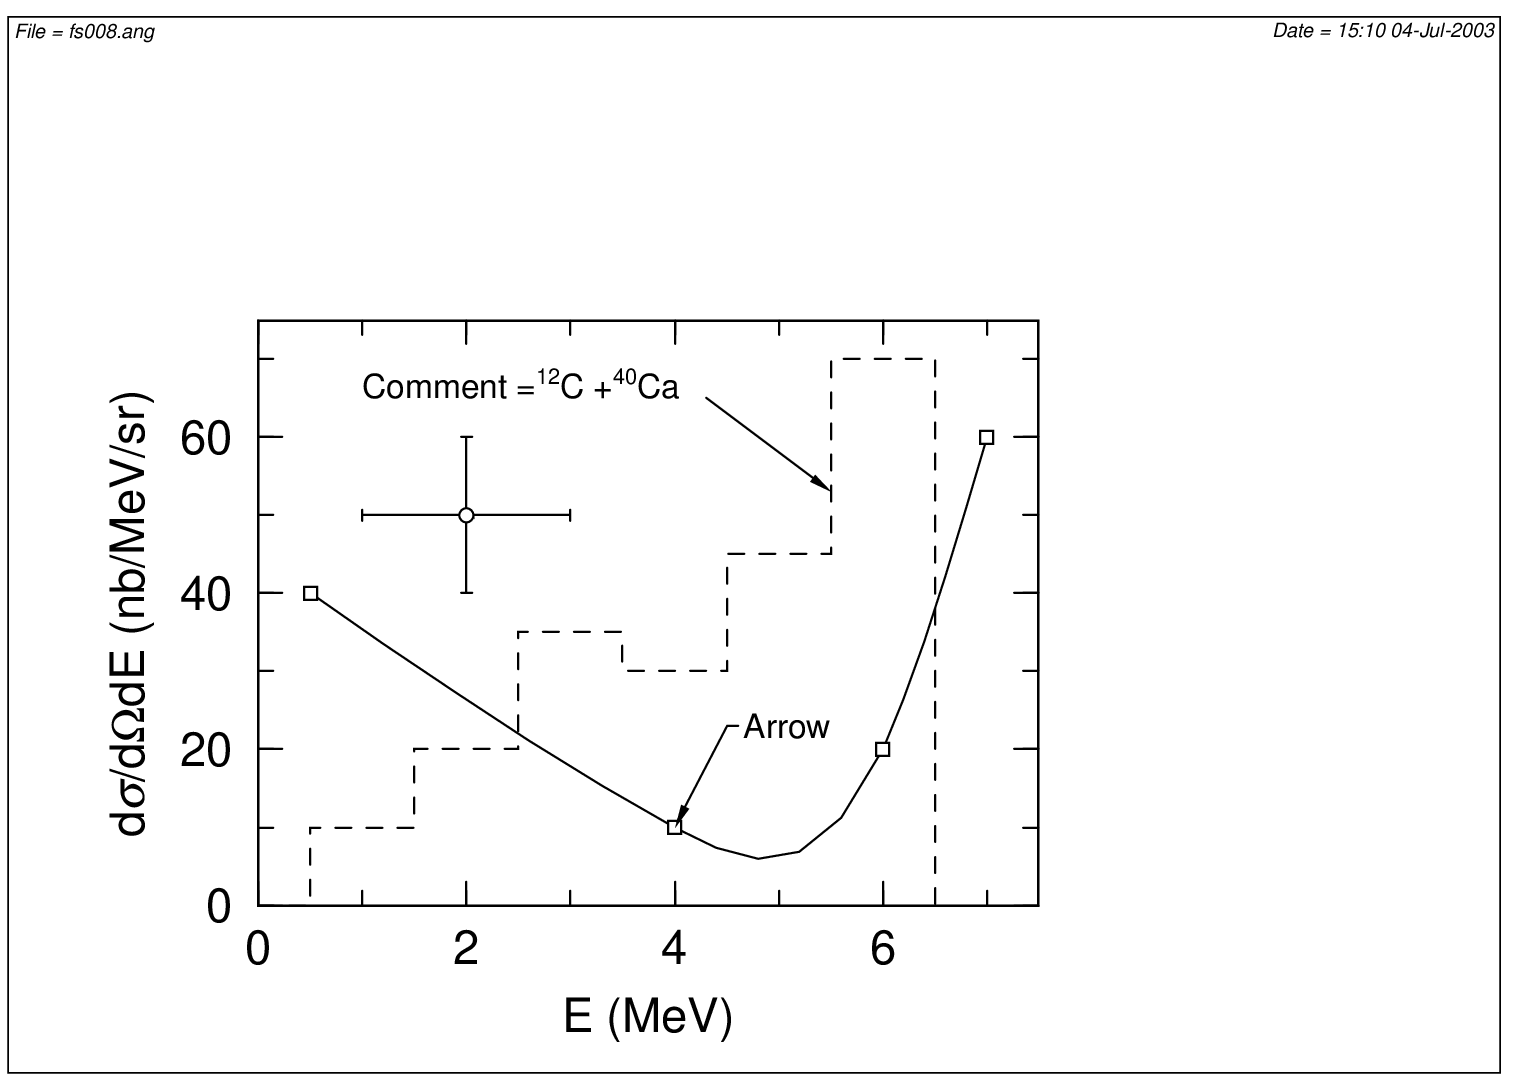
Each layout of the A4 paper is shown below. The outermost frame is the outline of the A4 paper.
2.18.2. Choice of paper
The default size of paper is A4, but the following parameters allow you to select the paper type.
parameter |
explanation |
|---|---|
|
Set the paper size to A4. (default) |
|
Set the paper size to US letter. |
|
Set the paper size to A3. |
|
Set the paper size to A5. |
|
Set the paper size to B3. |
|
Set the paper size to B4. |
|
Set the paper size to B5. |
2.18.3. Frame and message
parameter |
explanation |
|---|---|
|
Draw the outer frame of the paper. (default) |
|
Do not draw the outer frame of the paper. |
|
Set the frame color be \(c\) [1]. (D=e) |
|
Draw a message on the outer frame of the paper. (default) |
|
Do not draw the message on the outer frame of the paper. |
|
Set the color of all messages be \(c\). (D=e) |
2.18.4. Graph title
2.18.5. Position of graph
parameter |
explanation |
|---|---|
|
Defines the position of the origin of the axes. \((0,0)\) is the default, and its position is from the left and bottom edges of the paper frame, \((4.5cm, 3.0cm)\) for In the case of a multigraph, the origin positions of the second and subsequent graphs is the position of the previous graph. The unit of \((x, y)\) is X-axis and Y-axis length as 1, and it moves by \((x, y)\) from the default position. In the case of a multi-graph, the second and subsequent graphs are based on the length of the X-axis and Y-axis of the previous graph. |
|
Rotate the entire graph counterclockwise by \(a\) degrees around the origin. |
2.18.6. Scale
parameter |
explanation |
|---|---|
|
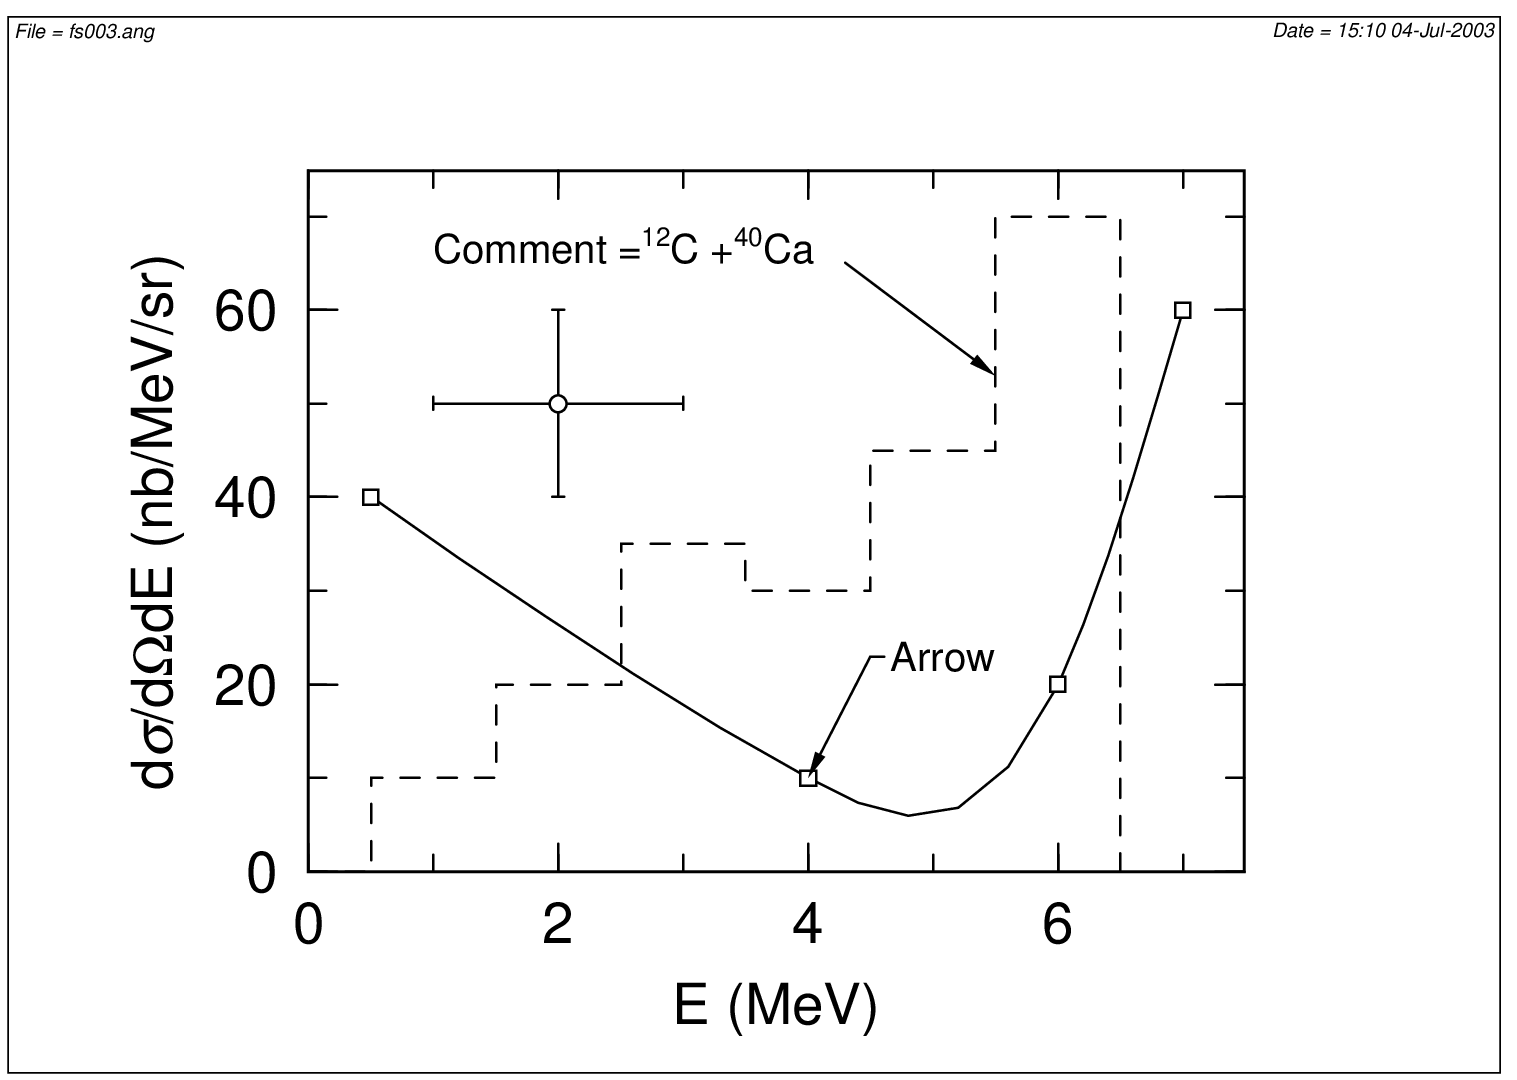
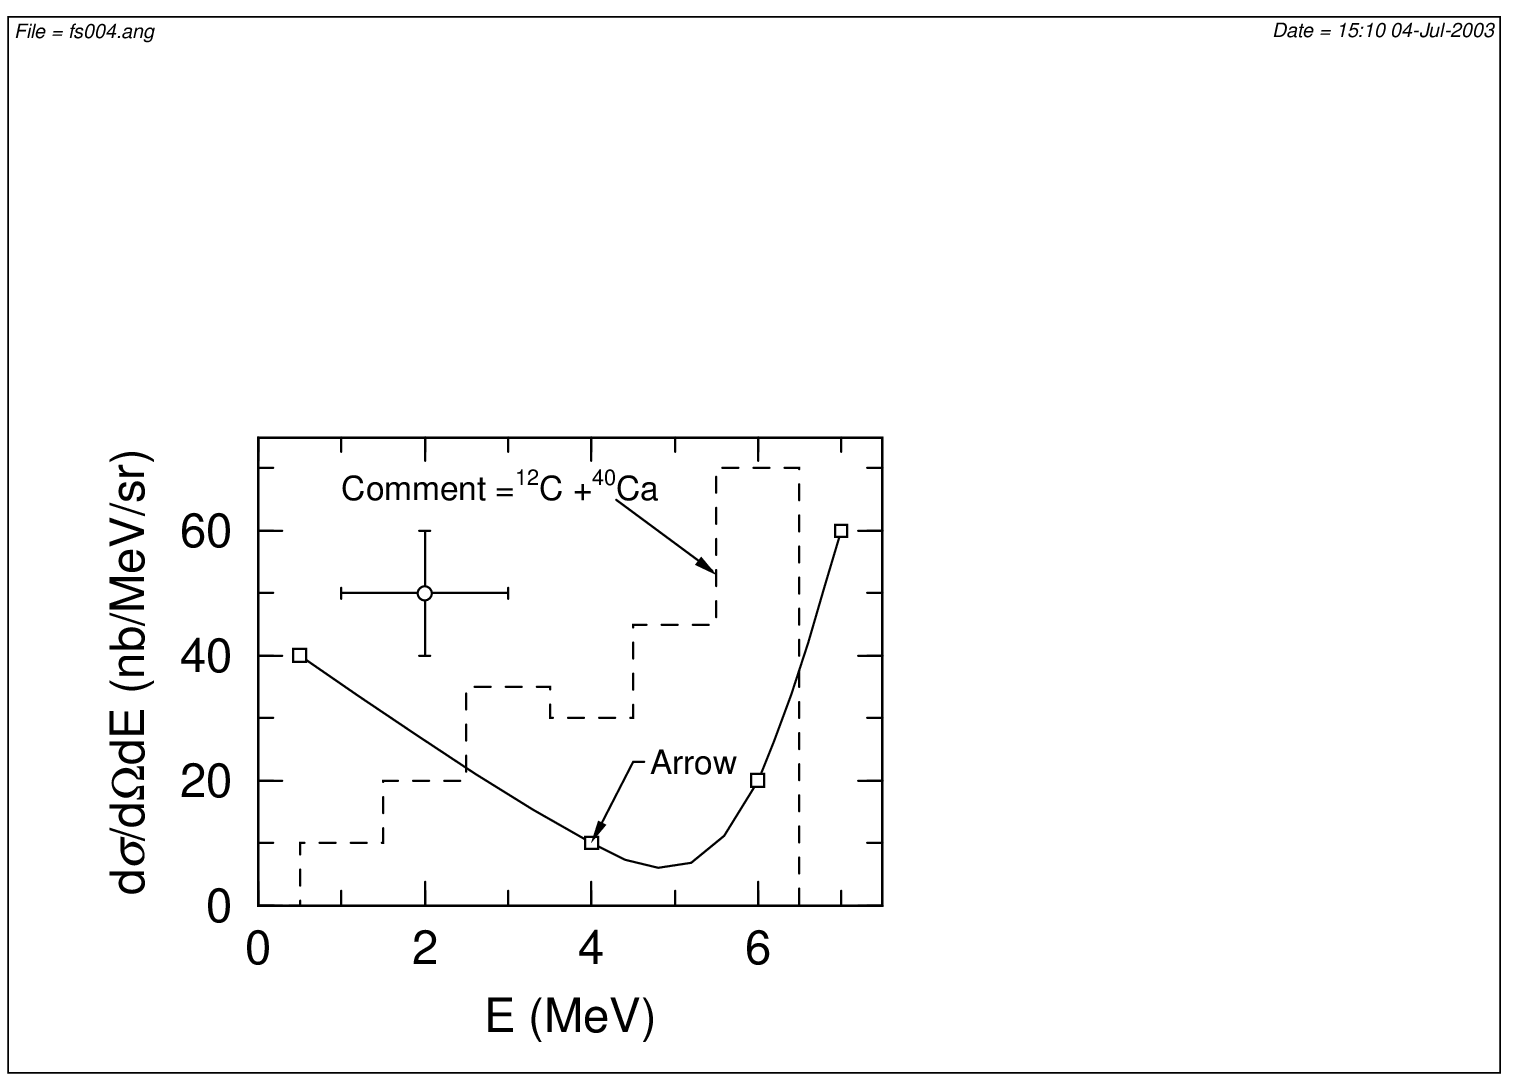
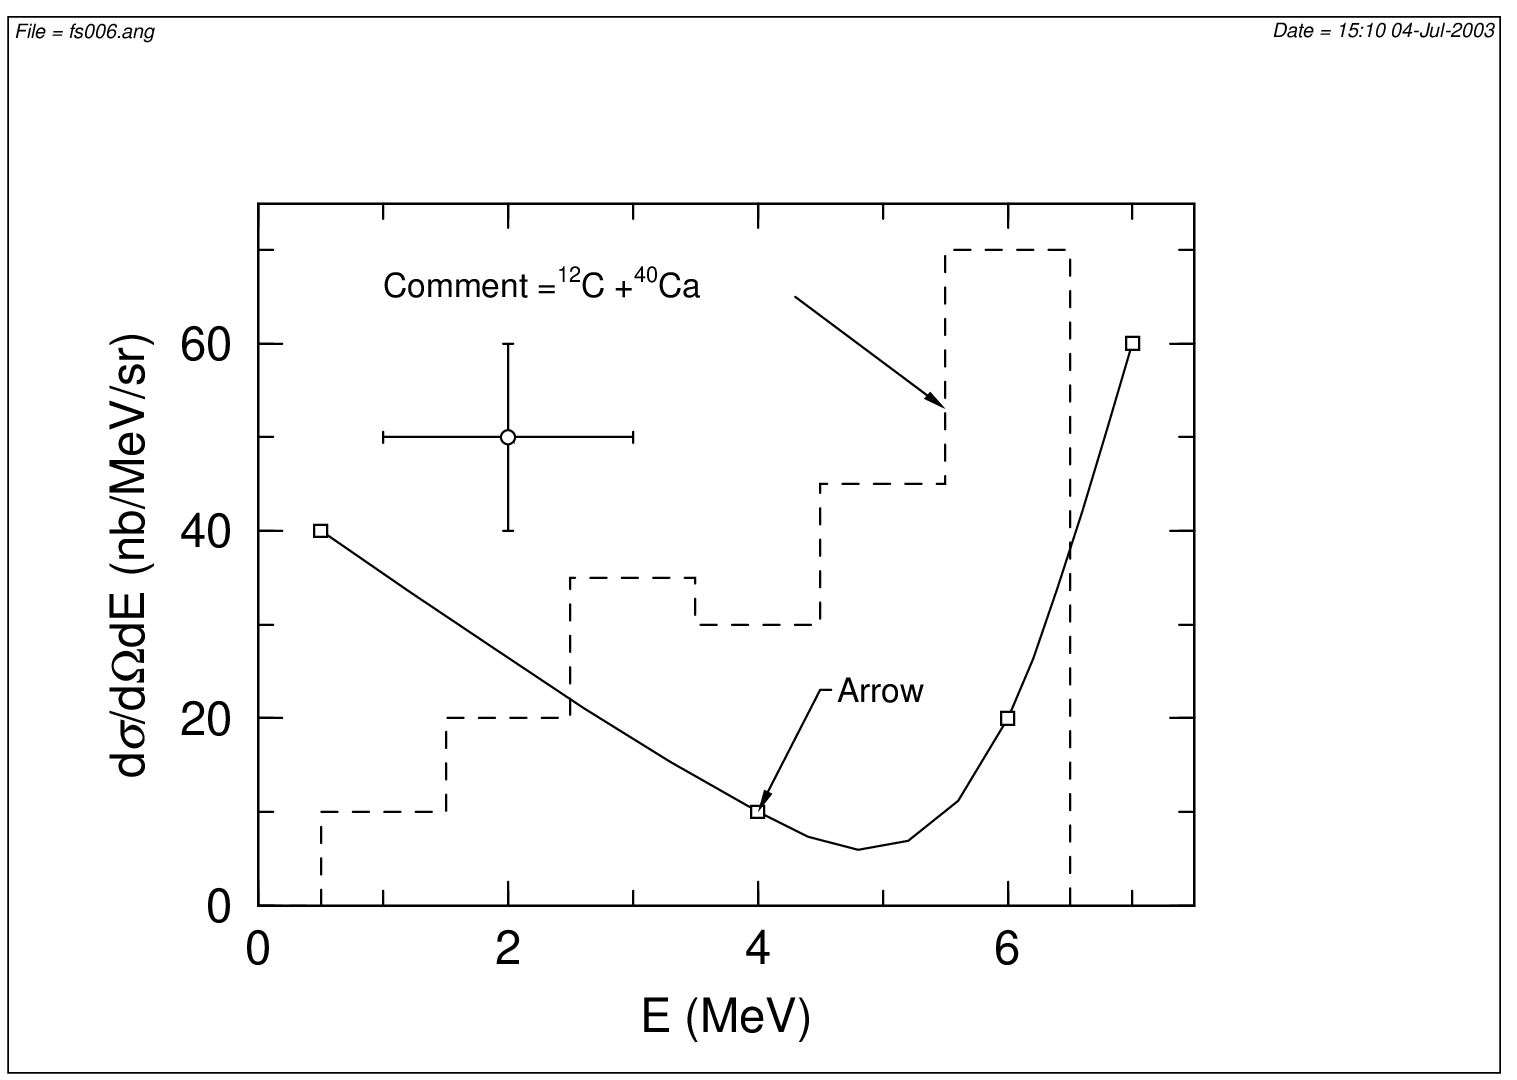
Scale the size of the entire graph. \(s = 1.0\) is the default and is specified as a ratio to the default. Scale everything including the position of the origin. |
|
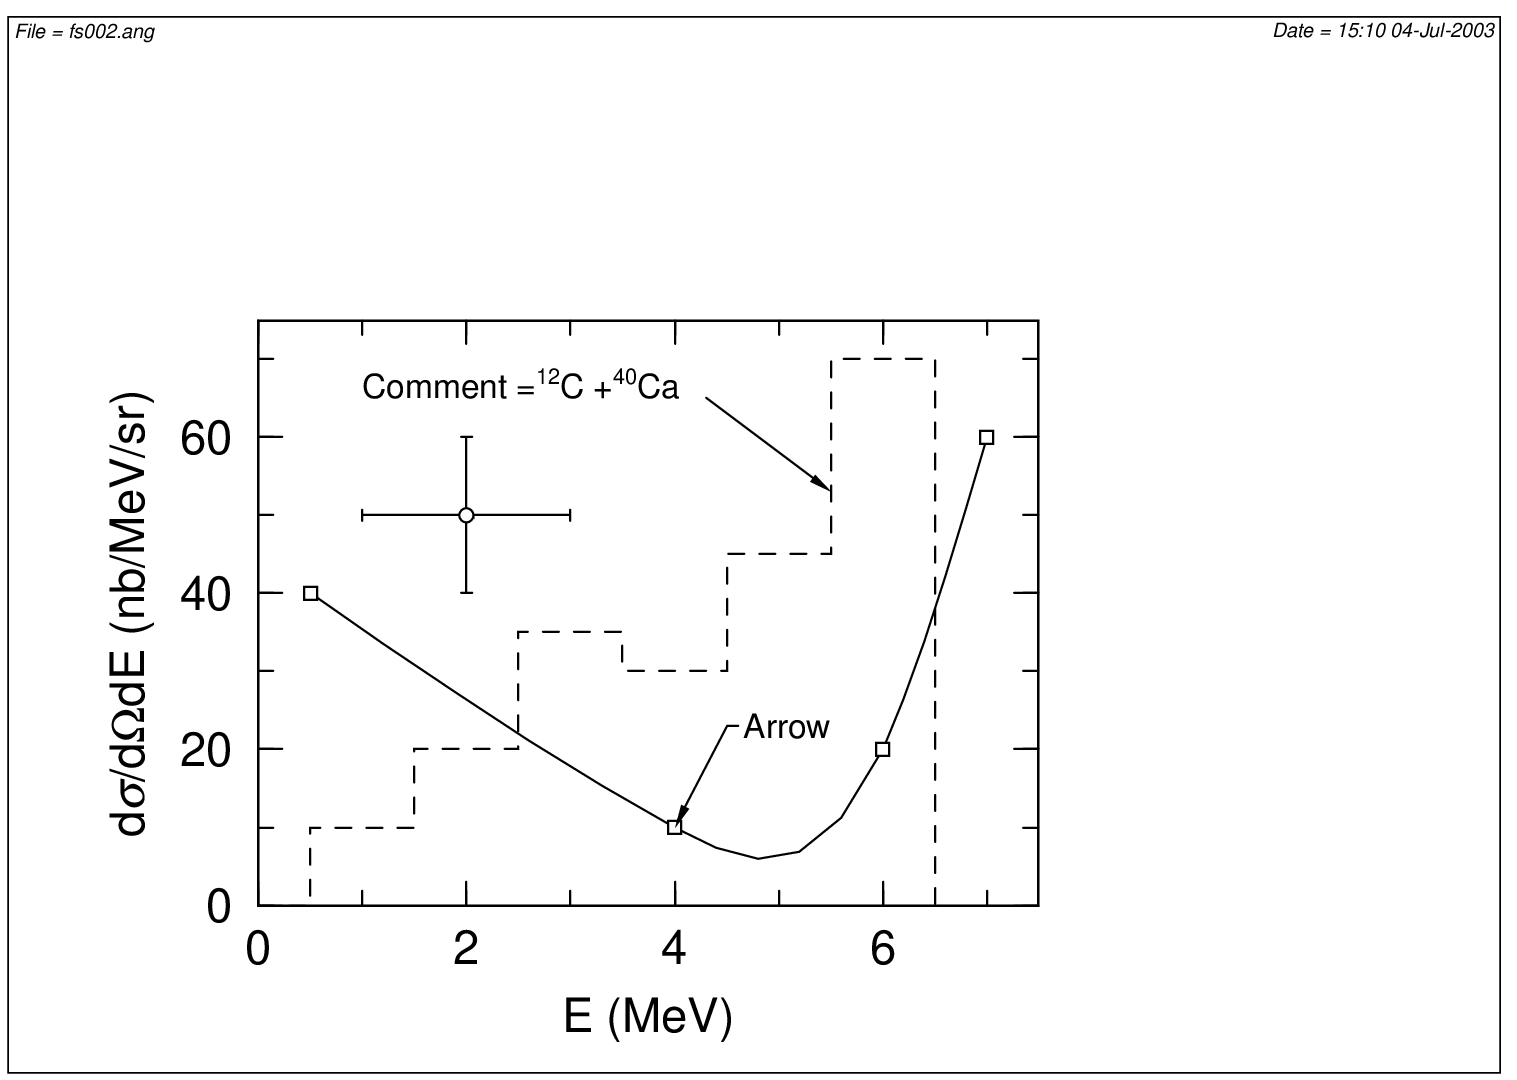
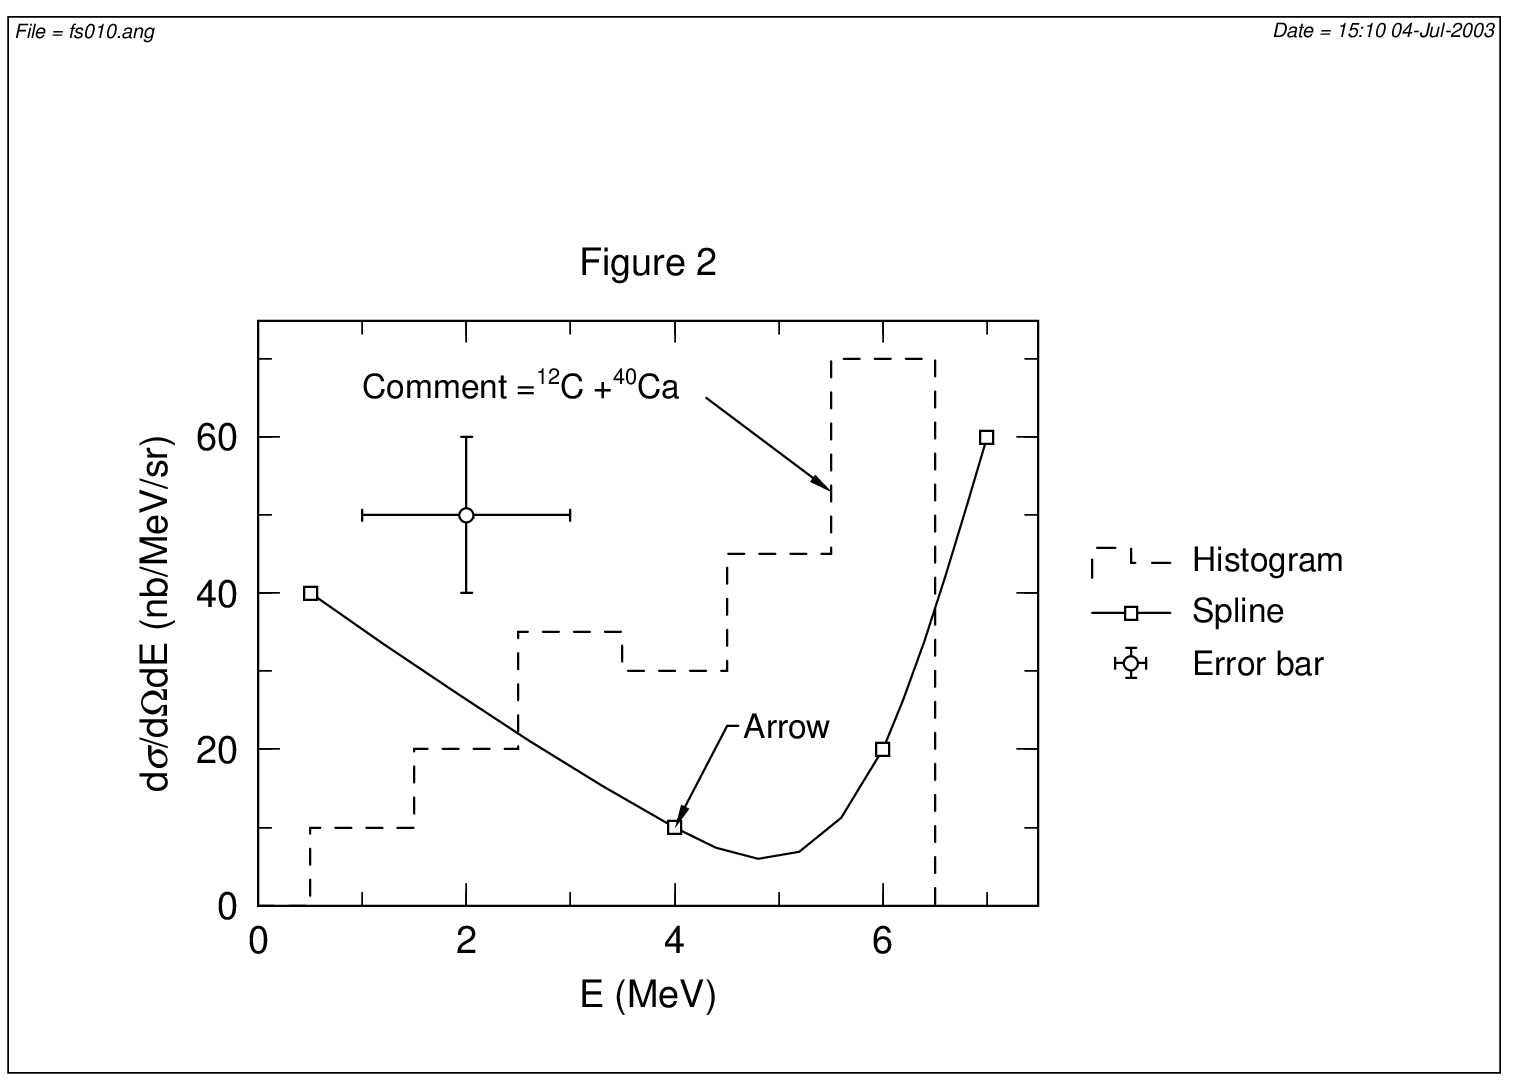
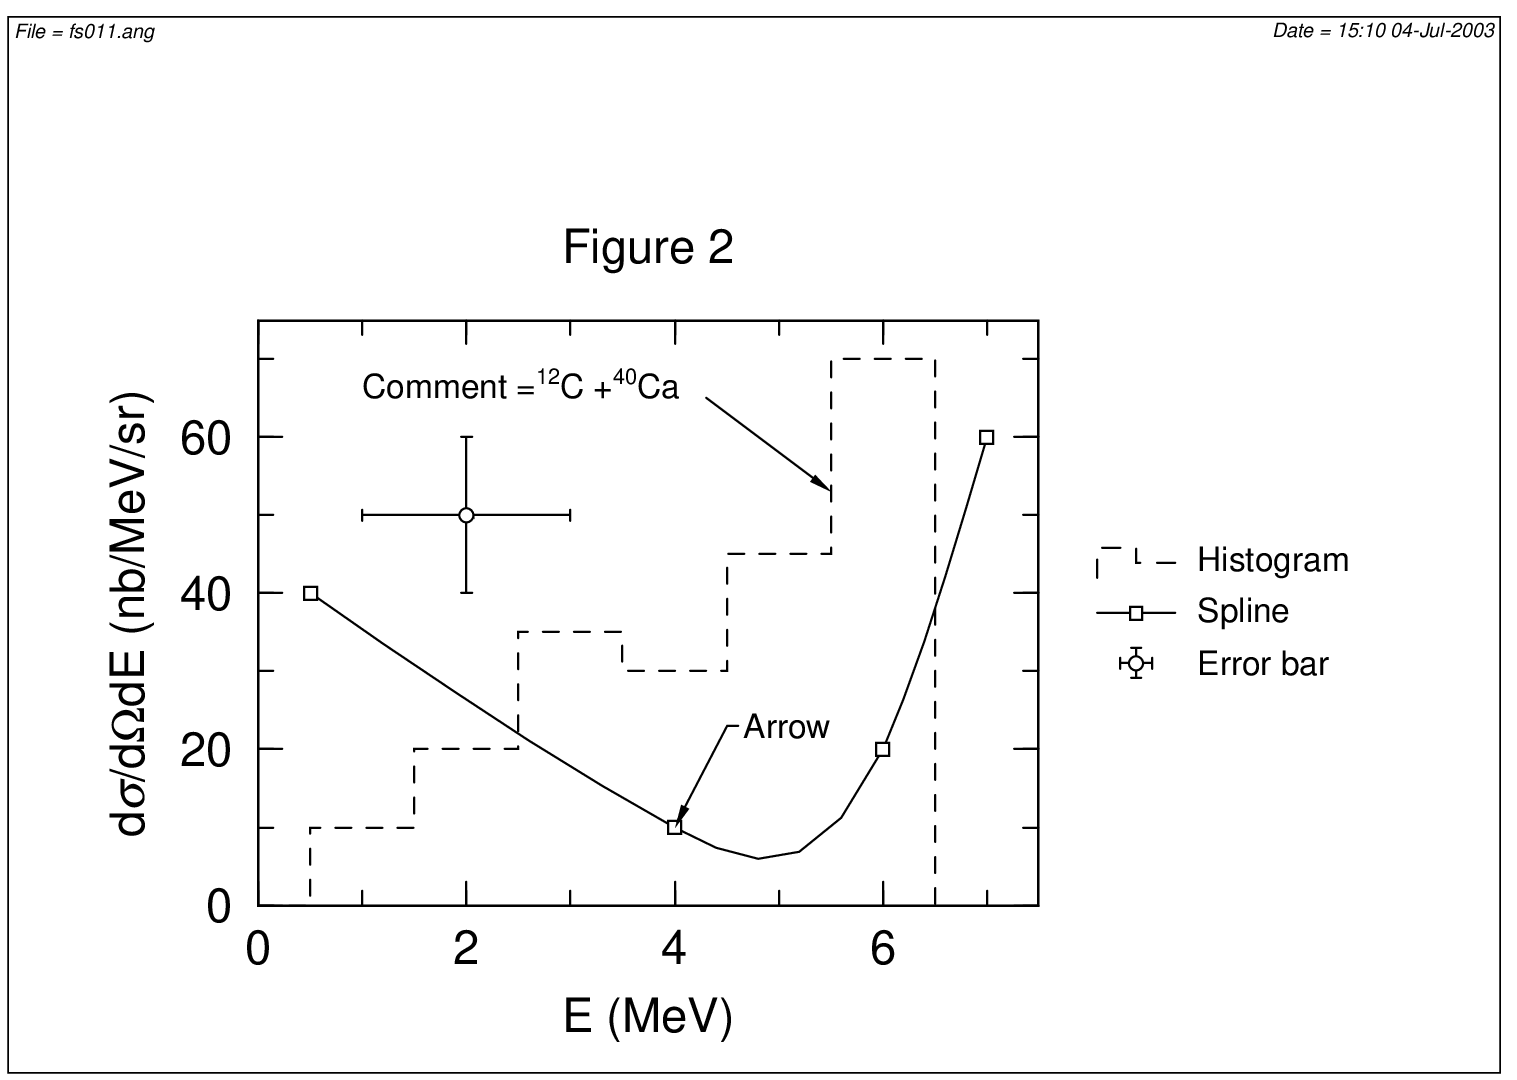
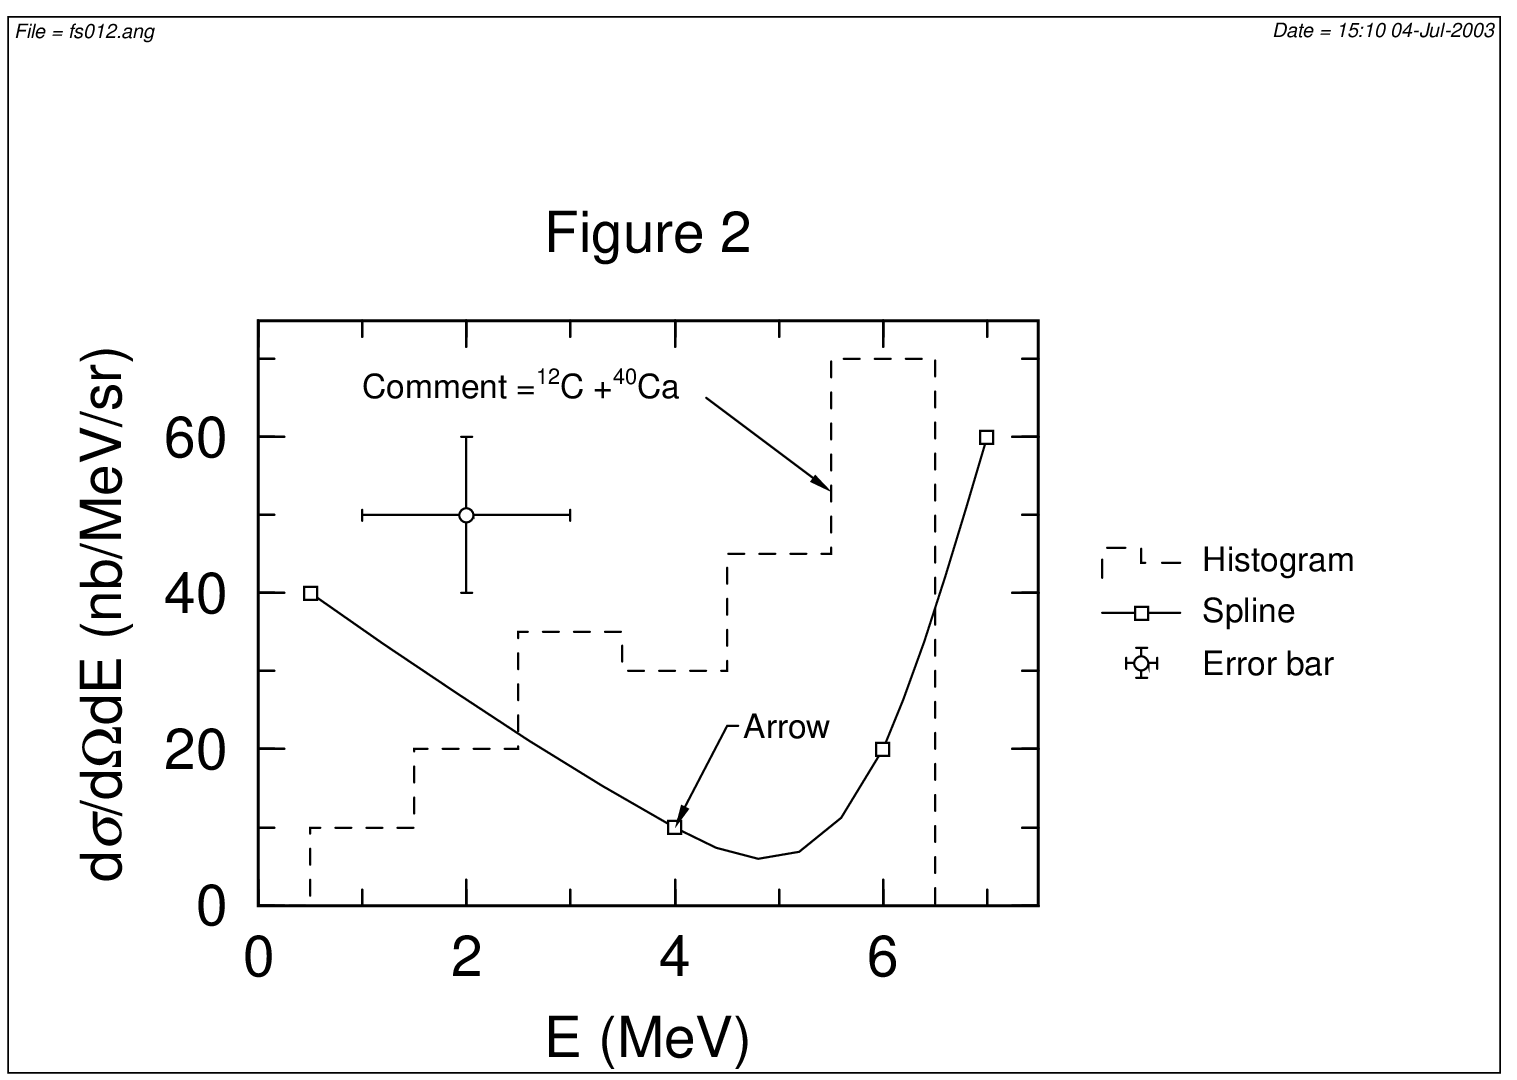
Specify the length of the X axis. \(x = 1.0\) is 14 cm in default. Specify \(x\) as a ratio to the default. |
|
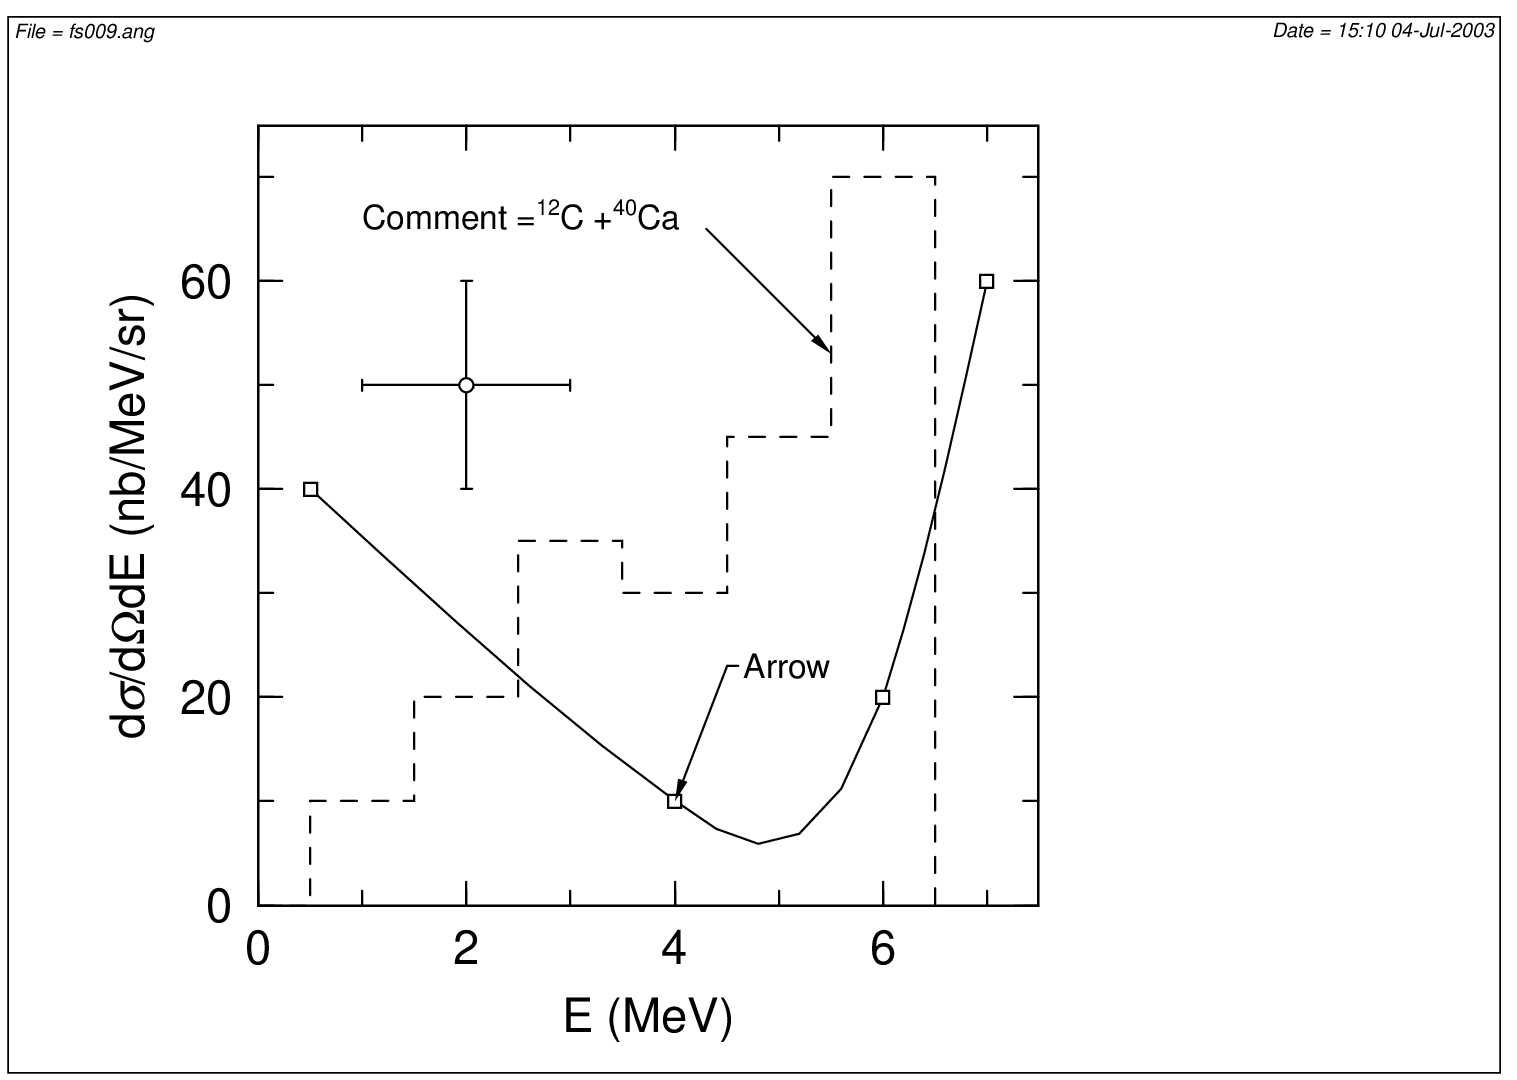
Specifies the ratio of Y-axis length to X-axis length. The default is \(f = Y / X = 0.75\). Even if this is changed, the position of the origin and the length of the X-axis do not change. That is, only the length of the Y-axis changes. |
|
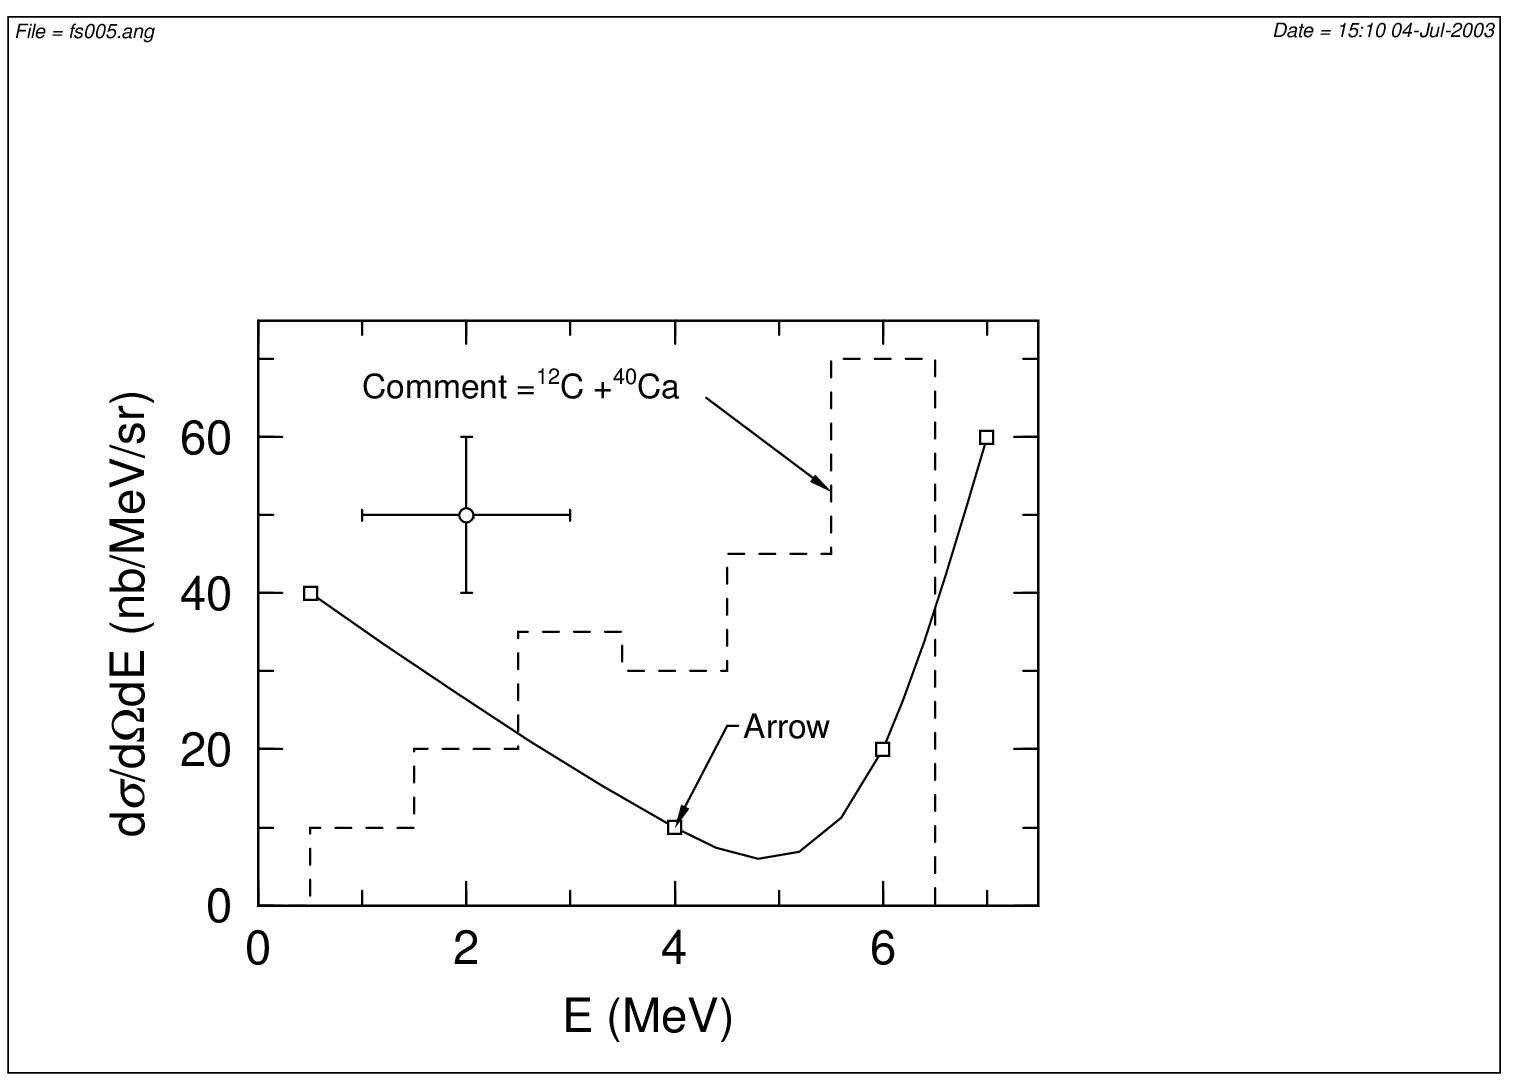
Scale the scale, thickness, numbers, text, and titles of the axes. \(a = 1.0\) is the default and is specified as a ratio to the default. Note that comments, arrow comments, legends, graph line thicknesses, are not scaled. |
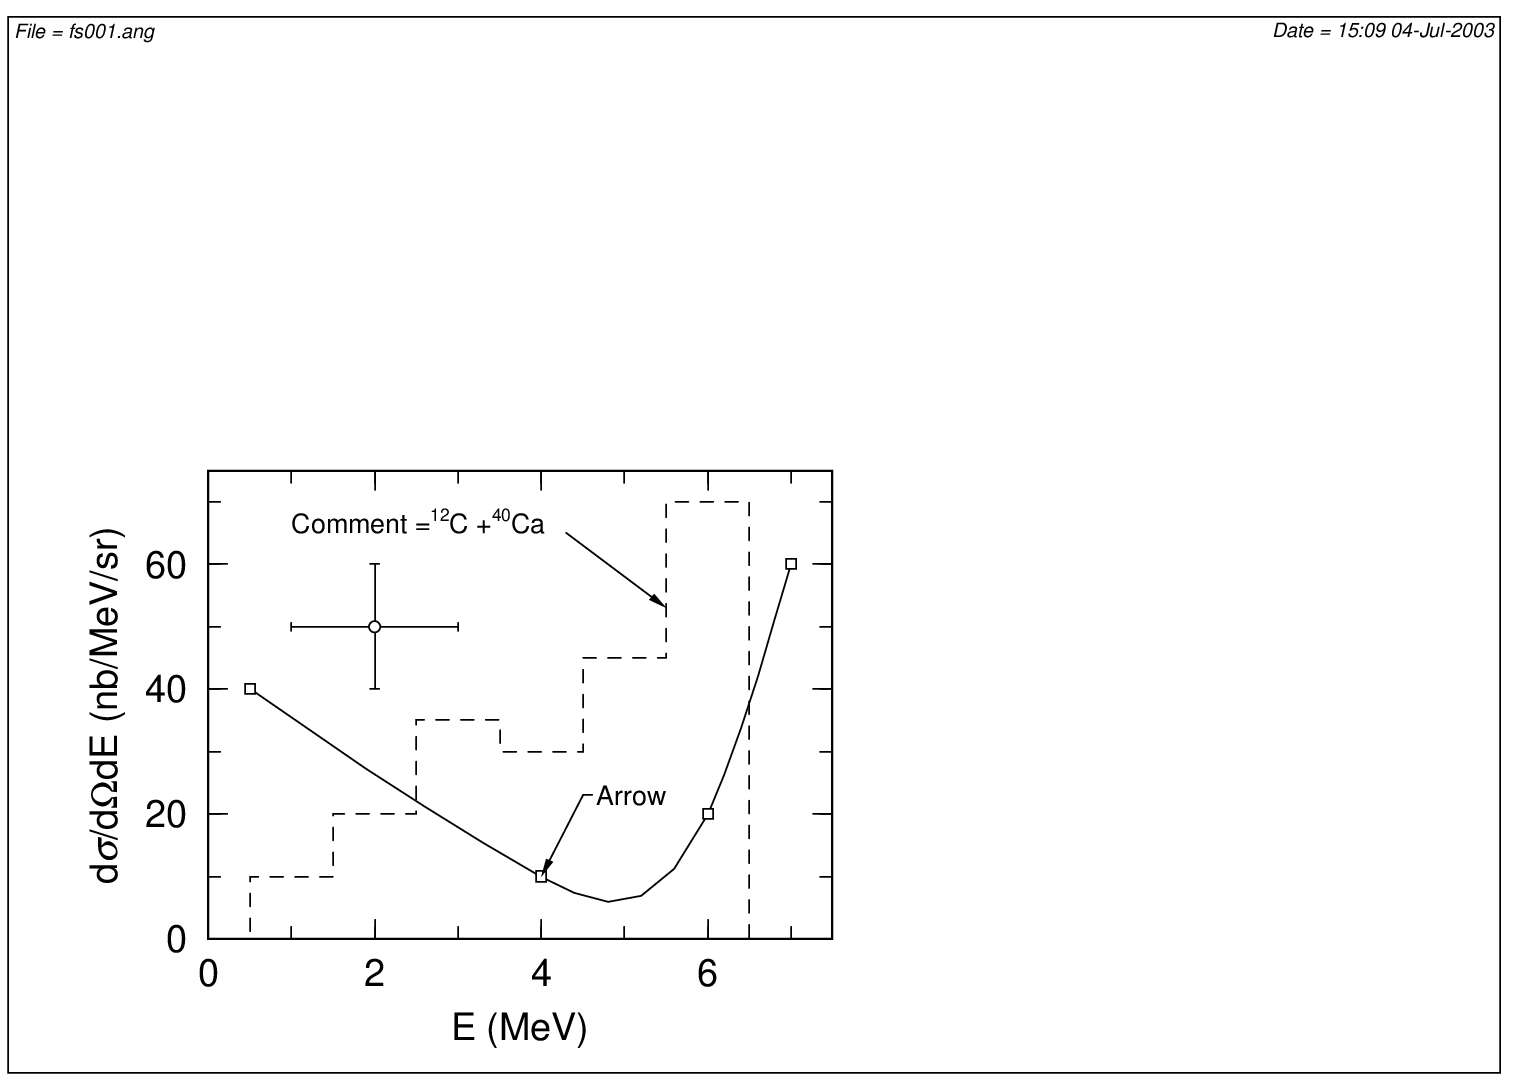
From the next page, we will show how the default output changes for each parameter due to changes in these parameters. The text may or may not change depending on the size of the graph, so combine them to draw the desired graph.
2.18.7. XY axis display
parameter |
explanation |
|---|---|
|
Displays the axis lines of the X and Y axes. (default) |
|
Does not display the axis lines of the X and Y axes. |
|
The X and Y axes are displayed in linear scale. (default) |
|
The X and Y axes are displayed in logarithmic scale. |
|
Decimal notation for horizontal axis values. |
|
Exponential notation for horizontal axis values. |
|
Decimal notation for vertical axis values. |
|
Exponential notation for vertical axis values. |
2.18.8. Title of XY axis
parameter |
explanation |
|---|---|
|
Multiply the size of the axis title by \(a\) (D=1) |
|
Set the position of the X-axis title be \(x\) with the axis length of 1. (D=0.5) |
|
Set the position of the Y-axis title be \(y\) with the axis length of 1. (D=0.5) |
|
Does not display the X-axis title. |
|
Does not display the Y-axis title. |
|
Set the color of the XY axis title be \(c\) [3]. (D=e) |
|
-1 = top, 0 = hidden, 1 = bottom (default), 2 = both sides. |
|
-1 = right, 0 = hidden, 1 = left (default), 2 = both sides. |
2.18.9. XY axis scale
parameter |
explanation |
|---|---|
|
-1 = top, 0 = hidden, 1 = bottom, 2 = both sides (default). |
|
-1 = right, 0 = hidden, 1 = left, 2 = both sides (default). |
|
-1 = outward, 0 = hidden, 1 = inward (default). |
|
Set tick spacing: -1 = narrower, 0 = default, 1 = wider. |
|
Explicitly specify the distance between long axis tick marks with \(x\), \(y\). |
|
Explicitly specify the distance between the short axis tick marks with \(x\), \(y\). |
|
Explicitly specify the coordinates of a point with a long axis scale in \(x\), \(y\). |
|
Explicitly specify the coordinates of a point with a short axis scale in \(x\), \(y\). |
|
Set the color of the graph frame and scale be \(c\) [4]. (D=e) |
Caution
From ANGEL ver.3, the parameters of XTIC, YTIC have been renamed. The previous XTIC, YTIC becomes XDTC, YDTC. The above function is newly added as XTIC, YTIC. Please change each one.
2.18.10. XY axis scale numbers
XY-axis tick numbers are displayed at the location of the long axis tick marks on the XY-axis.
parameter |
explanation |
|---|---|
|
Does not display X-axis scale numbers. |
|
Does not display Y-axis scale numbers. |
|
-1 = top, 0 = hidden, 1 = bottom (default), 2 = both sides. |
|
-1 = right, 0 = hidden, 1 = left (default), 2 = both sides. |
|
Explicitly specify the number of decimal places in the tick mark \(ix\), \(iy\). |
|
Let the color of the numbers on the XY axis scale be \(c\) [5]. (D=e) |
2.18.11. Macro parameters for XY axes
Macro parameters are prepared to specify some parameters related to the XY axes.
parameter |
explanation |
|---|---|
|
Does not display XY axis scales and scale numbers. |
|
Does not display XY axis scales, scale numbers, and titles. |
|
Does not display XY axis scales, scale numbers, titles, and axis lines. |
Here, NOTC can be used as an existing parameter, as the three parameter specifications of ITIC(0) NOXN NOYN. In addition to above parameters, NOXT and NOYT can be defined for NOXN, while NOTF can be defined for NOYN.
The following is a typical example when defining the display parameters for the XY axis title, axis scale, and axis scale numbers. Noted that other items are not displayed for each item. For example, in the axis title, the axis scale and the axis scale number are not displayed.
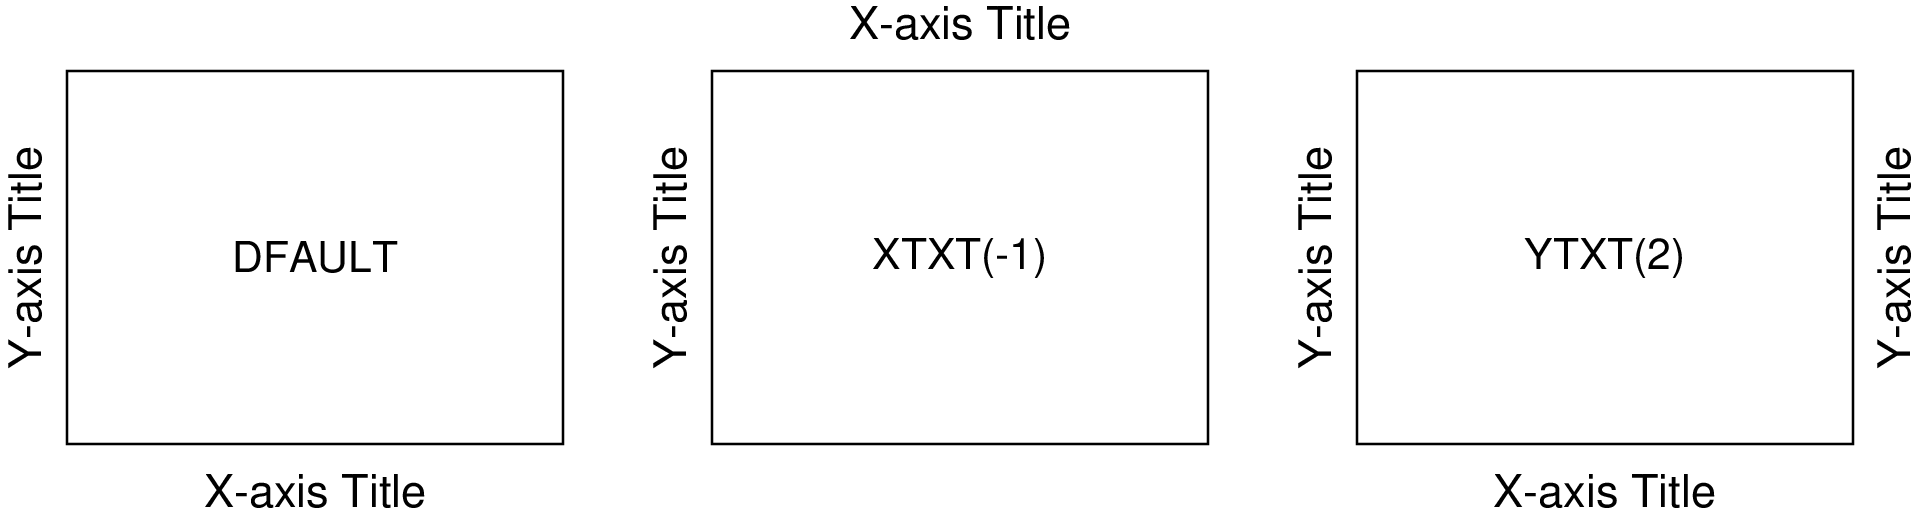
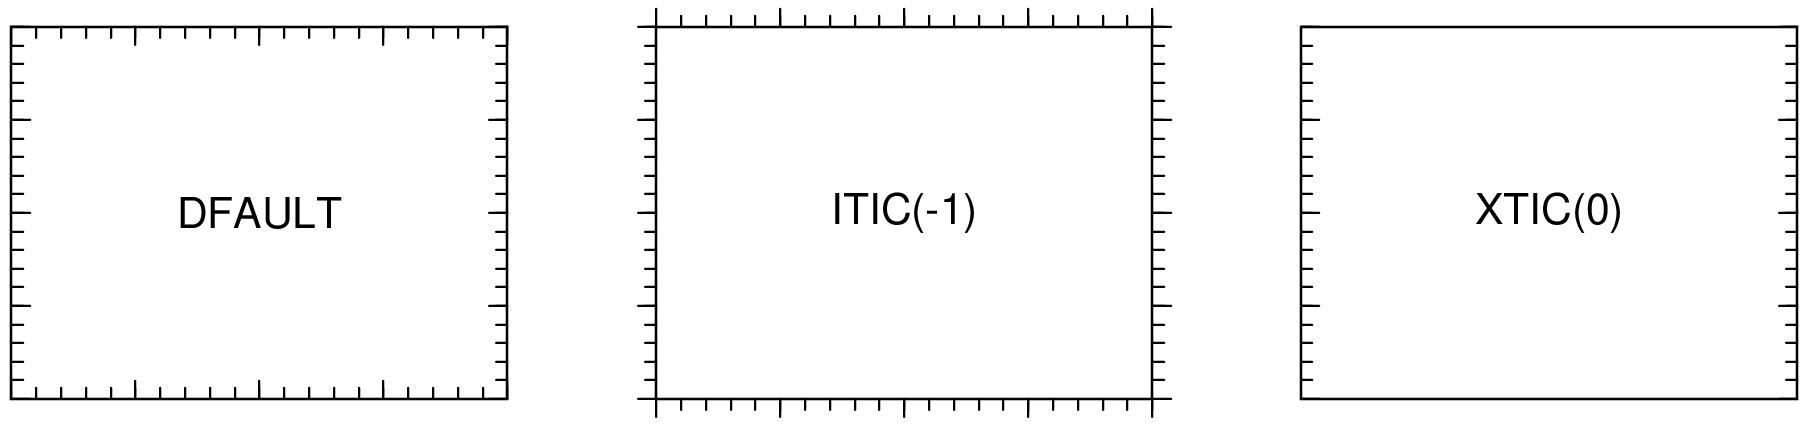
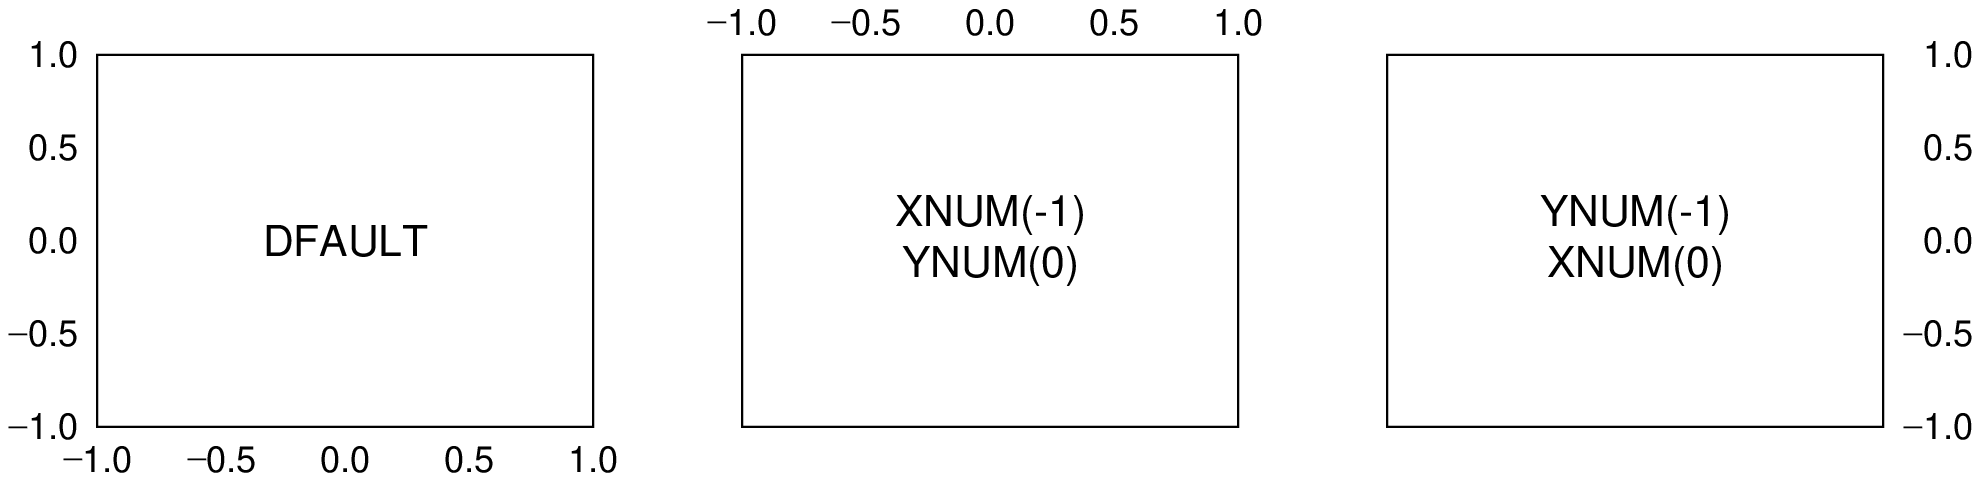
Fig. 2.52 XY axis title, Axis scale, Axis scale number
2.18.12. Maximum and Minimum
parameter |
explanation |
|---|---|
|
By default, the maximum and minimum values of X and Y axis are automatically determined from the range of the X and Y values. At that time, 7 % of the length of the X and Y axes is automatically added to the outside as a margin. If the sign of the value does not change and the minimum value (or maximum value) is less than 26% of the maximum value \(-\) minimum value, 0 is set to the minimum value (or maximum value). |
|
Set the X and Y margins to zero. This is convenient when you want to draw a contour map or explicitly specify the maximum and minimum values to draw the axes. |
|
Set the X margin to zero. |
|
Set the Y margin to zero. |
XMIN(xmin) XMAX(xmax) YMIN(ymin) YMAX(ymax) |
Explicitly specify the maximum and minimum values for the X and Y axes. If this is not specified, it will be automatically determined from the input data. Also, if |
2.18.13. Unit conversion and scale
If the display of the axis in units of time and length is linear, if the real number is large, or if there are many numbers after the decimal point, the scale display of these axes may be difficult to see. In this case, you can adjust the axis using the factor in the H: line. When the X-axis titles are [nsec] (nanosec), [cm] or [sec], you can use the following parameters for adjusting scale and axis. In the same manner, you can also change the title at the same time.
parameter |
explanation |
|---|---|
|
Scales [nsec] (nanosec) to [psec] (pico sec). |
|
Scale [nsec] (nanosec) to [\(\mu\)sec] (microsec). |
|
Scales [nsec] (nano sec) to [msec] (milli sec). |
|
Scales [nsec] (nanosec) to [sec]. |
|
When scaling [nsec] (nanosec) with the above parameters, if the Y-axis title has /nsec, the Y-axis units will also be scaled. |
parameter |
explanation |
|---|---|
|
Scale [cm] to [nm] (nanometer). |
|
Scale [cm] to [\(\mu\)m] (micrometer). |
|
Scale [cm] to [mm]. |
|
Scale [cm] to [m]. |
|
Scale [cm] to [km]. |
|
When scaling [cm] with the above parameters, if the Y-axis title has /cm, the Y-axis units will also be scaled. |
parameter |
explanation |
|---|---|
|
Scales [sec] to [sec]. (default) |
|
Scale [sec] to [min]. |
|
Scale [sec] to [hour]. |
|
Scales [sec] to [day]. |
|
Scale [sec] to [year]. |
In default, the unit for [sec] is scaled to minutes for the case of 10 minutes more and less than 10 hours, to hours for 10 hours more and less than 10 days, to days for 10 days more and less than 10 years, and to years for 10 years more. If you want to scale the units by users use the parameters above.
parameter |
explanation |
|---|---|
XMUL(xfac) YMUL(yfac) ZMUL(zfac) |
Scales the X, Y, Z axes by \(xfac\), \(yfac\), \(zfac\). |
2.18.14. User-defined constant display
parameter |
explanation |
|---|---|
|
Displays user-defined constants. |
|
Does not display user-defined constants. (default) |
|
The position of the left end of the constant display is \(x\) n the X coordinate. |
|
The position of the upper end of the constant display is \(y\) in the Y coordinate. |
|
The size of the constant display is \(s\) with the default value of 1. |
|
The color of the characters in the constant display is \(c\) [6]. (D=e) |
|
Enclose the entire constant display in a box of \(boxname\) [7]. |
|
Set the background color of the constant display box be \(cb\). (D=w) |
|
The color of the frame of the constant display box is \(cl\). (D=e) |
|
Set the shadow color of the constant display box be \(cs\). (D=e) |
2.18.15. Function fit coefficient display
parameter |
explanation |
|---|---|
|
Displays the function fit coefficient. |
|
Does not display the function fit coefficient. (default) |
|
Set the position at the left end of the coefficient display be \(x\) in the X coordinate. |
|
Set the position of the upper end of the coefficient display be \(y\) in the Y coordinate. |
|
The size of the coefficient display is \(s\) with the default value of 1. |
|
The color of the characters in the coefficient display is \(c\) [8]. (D=e) |
|
Enclose the entire coefficient display in a box of \(boxname\) [9]. |
|
Set the background color of the coefficient display box be \(cb\). (D=w) |
|
Set the color of the frame of the coefficient display box be \(cl\). (D=e) |
|
set the shadow color of the coefficient display box be \(cs\). (D=e) |
2.18.16. Legend display
parameter |
explanation |
|---|---|
|
Display the legend. (default) |
|
Does not display the legend. |
|
Set the leftmost position of the legend be \(x\) in the X coordinate. |
|
Set the position of the top of the legend be \(y\) in the Y coordinate. |
|
Set the legend size be \(s\) with a default value of 1. |
|
Let the text color of the legend be \(c\) [10]. (D=e) |
|
Enclose the entire legend in a box of \(boxname\) [11]. |
|
Set the background color of the legend box be \(cb\). (D=w) |
|
Set the frame color of the legend box be \(cl\). (D=e) |
|
Set the shadow color of the legend box be \(cs\). (D=e) |
2.18.17. Change of line type pattern length and symbol
parameter |
explanation |
|---|---|
|
Set the pattern length be \(r\) with a default value of 1. |
|
Set the thickness of the line that draws the symbol be \(r\) with a default value of 1. |
2.18.18. Contour
parameter | explanation |
|
|---|---|
|
Set the number of contour lines be \(i\). The default is 8. |
|
Specify the height of the contour lines with \(r_1, r_2, ...\). The number is free. Also, the order of the size of \(r_1, r_2, ...\) is arbitrary. If not specified, 8 contour lines will be inserted, which are the intervals between the maximum and minimum heights divided into 8 equal parts. |
|
Set the contour color be \(c\) [12]. |
|
\(c_1, c_2, c_3, ...., c_N\) specifies the color and grayscale. The contour lines with these colors corresponds to those specified by |
|
If you specify only |
|
Specifies the maximum and minimum color. |
|
The defaults are red (R) and blue (B). |
|
Divide the height of the contour lines into equal parts with a linear scale. (default) |
|
Divide the height of the contour lines into equal parts in logarithmic scale. |
|
Specifies the line thickness of the contour lines. The default is \(id = 4\) in the unit of \(1/300\) inch. |
|
Interpolates and smooths contour lines. By default, 4-point interpolation is performed, and to increase the number of interpolation points, use |
|
Smooth the mesh data with Gauss smearing. By default, adjacent meshes (\(n=1\)), to increase the number of meshes, use |
2.18.19. Cluster plot
parameters |
explanation |
|---|---|
|
Specify the size of the cluster. By default, the maximum value fills the entire rectangle, and the other values fill the area proportional to the height of the data relative to the maximum value. \(f = 1\) (default) means that the entire rectangle is filled by the cluster, and the value of \(f\) specifies the size of the rectangle for the maximal value. |
|
The size of the cluster is determined proportional to the height of the data in linear scale (default), |
|
The size of the cluster is determined proportional to the height of the data in logarithmic scale. |
|
Set \(dmax\) as the maximum value, neglect the data which values are greater than \(dmax\). |
|
Set \(dmin\) as the minimum value, neglect the data which values are smaller than \(dmin\). |
|
Display the data which value is greater than \(cmax\) in size of the \(cmax\). |
|
Display the data which value is smaller than \(cmin\) in size of the \(cmin\). |
|
Set the cluster color to \(c\) [13]. |
2.18.20. Color cluster plot
parameters |
explanation |
|---|---|
|
The color of the cluster is determined proportional to the height of the data in a linear scale. (default). |
|
The color of the cluster is determined proportional to the height of the data in a logarithmic scale. |
|
Set \(dmax\) as the maximum value, neglect the data which values are greater than \(dmax\). |
|
Set \(dmin\) as the minimum value, neglect the data which values are smaller than \(dmin\). |
|
Display the data which value is greater than \(cmax\) in color of the \(cmax\). |
|
Display the data which value is smaller than \(cmin\) in color of the \(cmin\). |
|
Specify the maximum and minimum color |
|
THe default are red(R) and blue(B). |
|
Automatically interpolate by halving the mesh spacing. |
2.18.21. Color
parameter |
explanation |
|---|---|
|
Enable color (default) |
|
Makes everything where the color is set black and white. |
|
|
You can lighten the grayscale tones by specifying \(0 \le c \le 1\). |
|
|
Set all colors be \(c\) [14] (D=e) |
|
Set the color of frame be \(c\) (D=e) |
|
Set the color of all messages be \(c\). (D=e) |
|
Set the color of the graph title be \(c\). (D=e) |
|
Set the color of the XY axis title be \(c\). (D=e) |
|
Set the color of the graph frame and scale be \(c\). (D=e) |
|
Set the color of the numbers on the XY axis scale be \(c\). (D=e) |
|
Set the background color outside the axes be \(c\). (D=w) |
|
Set the background color in the axes be \(c\). (D=w) |
|
Set the text color of the legend be \(c\). (D=e) |
|
Set the color of the characters in the constant display be \(c\). (D=e) |
|
Set the color of the text in the coefficient display be \(c\). (D=e) |
|
Set the color of the cluster be \(c\). (D=e) |
2.18.22. BoundingBox display
parameter |
explanation |
|---|---|
|
The Bounding Box is displayed as a red line. |
|
Does not display the Bounding Box. (default) |
2.18.23. Debug output
parameter |
explanation |
|---|---|
|
Write the comments in the EPS file for debugging. |
|
Compact EPS output. (default) |
2.18.24. Font parameter
parameter |
explanation |
|---|---|
|
Set the font of the text be \(f\) [15]. (D=0) |
|
Let the font of the scale numbers be \(f\). (D=0) |
|
Set the output of |
2.18.25. Macro parameter
parameter |
explanation |
|---|---|
|
Does not display XY axis scales and scale numbers. |
|
Does not display XY axis scales, scale numbers, and titles. |
|
Does not display XY axis scales, scale numbers, titles, and axis lines. |
|
Does not show all comments. |
|
Set the scale coordinates for A4 Horizontal graph paper. |
|
Set the scale coordinates for A4 Vertical graph paper. |
These parameters are useful when making slides for presentations. Place titles and graphs with SECL, SECP, and finally use NOTF to turn off the scale. The output of SECL and SECP is shown on the next page.