2.14. HB: Bitmap plot section
The HB: section can draw a color bitmap at (x, y) coordinate. The shape of the bitmap is rectangular and the width and height can be defined by user. 3D perspective diagrams output by other programs can be converted to PS. In addition to rectangular bitmaps, you can also define color areas of any shape. You can also define a path to clip the whole thing.
2.14.1. Basic style
The bitmap plot section has four subsections. The basic style is
HB: CLIP NOCLIP LINE NOLINE C( c ) CB( cb ) HSB RGB T Z
FRAME:
   x1   y1
   x2   y2
   ...   ...
   ...   ...
CLIP:
   x1   y1
   x2   y2
   ...   ...
   ...   ...
PATH: C( cp )
   x1   y1
   x2   y2
   ...   ...
   ...   ...
BMAP: WIDTH = w   HIGHT = h
   x1   y1   c1   c2   c3
   x2   y2   c1   c2   c3
   ...   ...   ...   ...   ...
   ...   ...   ...   ...   ...
The FRAME :, CLIP :, PATH :, BMAP: subsections are optional. However, one of subsection, i.e,, CLIP :, PATH :, BMAP:, must be included at least once. Each subsection of FRAME :, CLIP: is not allowed to be defined more than once. The path defined by FRAME :, CLIP: clips the bitmap. FRAME: is a higher clipping path than CLIP :. PATH : and BMAP: can be defined any number of times. PATH: must be defined each time the area and color change, and BMAP: must be defined each time the bitmap size changes. When drawing, please define PATH: and then surely overwrite BMAP :.
2.14.2. Parameters for the bitmap plot
parameters |
explanation |
|---|---|
|
Clip the path defined by |
|
(default) Do not clip the path defined by |
|
Illustrate the path defined by |
|
(default) Do not insert the path defined by |
|
Let the color of the clipping path be \(c\) [1] (D=e) . |
|
Let the color of the clipping path area be \(cb\) [1] (D=w). |
|
Make the clipping-path line thicker; repeat for a thicker line. |
|
Make the clipping-path line thinner; repeat for a thinner line. |
|
(default) Defines the color of BMAP: by a HSB value. |
|
Defines the color of BMAP: by an RGB value. |
|
Let the color of the area of PATH: be \(cp\) [1]. |
|
Let the width of the bitmap be \(w\) (cm). |
|
Let the height of the bitmap be \(h\) (cm). |
2.14.3. Example for bitmap plot
Here is a simple result of the 3D perspective diagram calculated by PHITS . The use of bitmap plots uses the output of other programs, and we would like you to use them in various ideas.
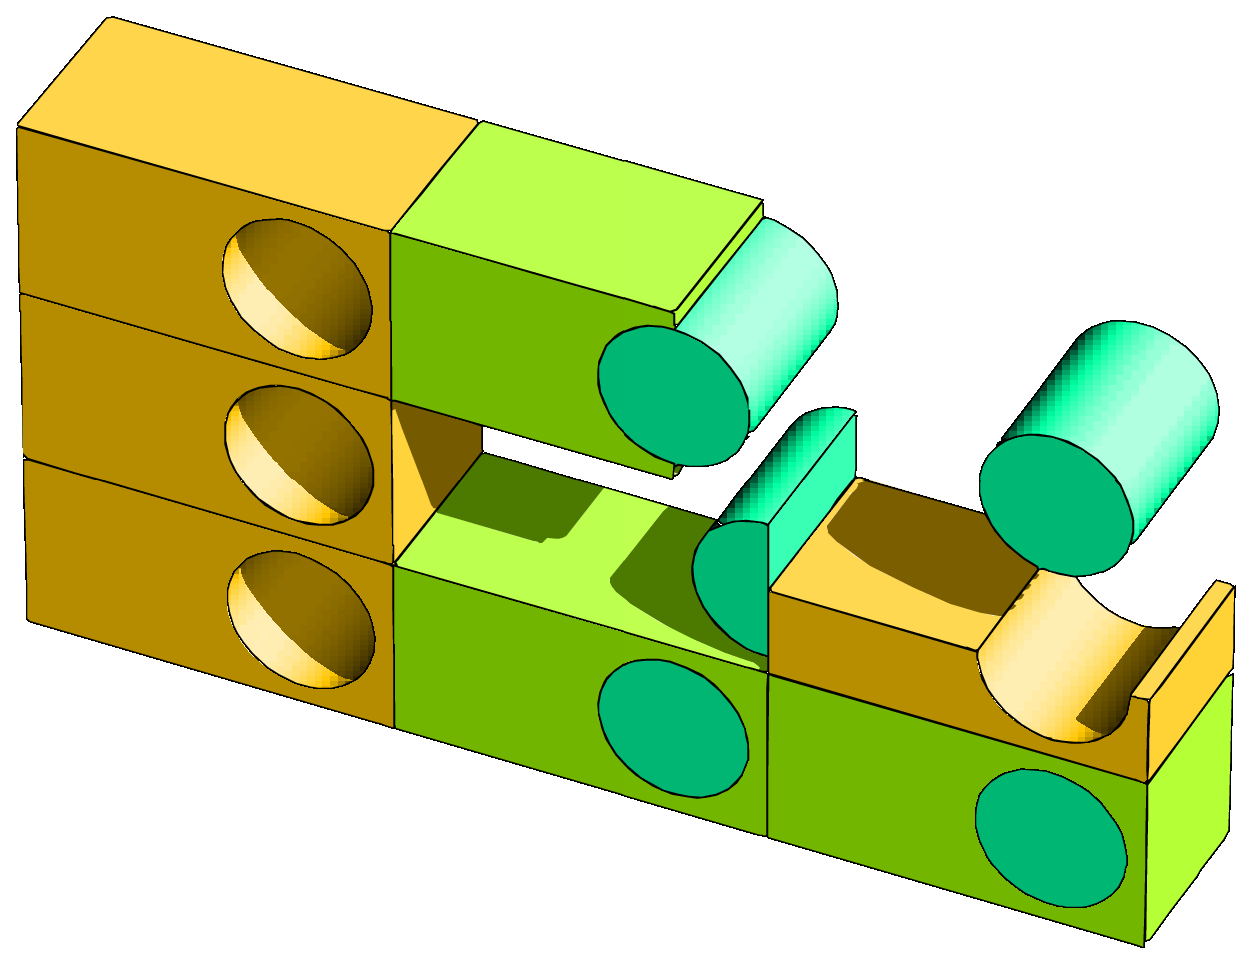
Fig. 2.17 Example for bitmap plot