2.12. HD: Two dimensional cluster plot section
2.12.1. Basic style
HD: section specifies a two-dimensional cluster plot. A cluster plot is a plot of heights given to a two-dimensional equally spaced mesh that fills a rectangle around that point with a size proportional to the height of each point.
The basic format is exactly the same as the H2: section. A cluster plot described using the same data as the contour example gives:
List 2.17 • Two dimensional cluster plot, example 1
1:  HD: Y = 3.0 TO -3.0 BY -1.0 ; X = -3.0 TO 3.0 BY 1.0 ;
2:   0    0    0    0    0    0    0
3:   0    8    0    2    4    0    0
4:   0    0    1    5    6    2    0
5:   0    2    4   14   15    9    0
6:   0    2    5   23   32   12    0
7:   0    0    3   10   16    8    0
8:   0    0    0    0    0    0    0
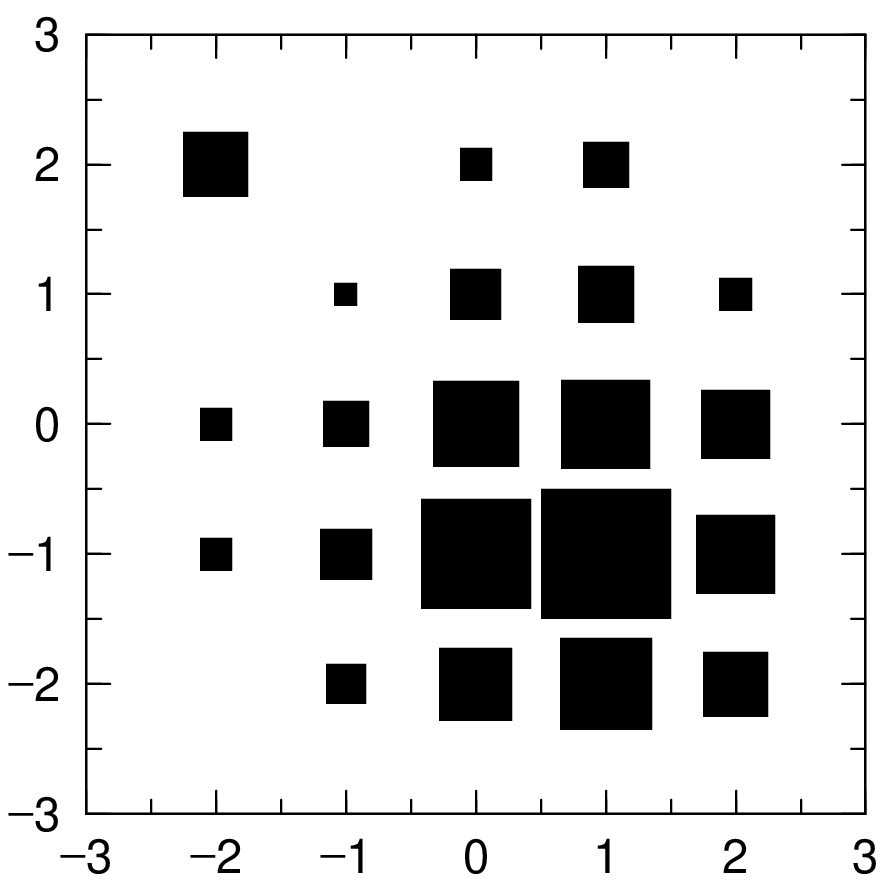
Fig. 2.13 Two dimensional cluster plot, example 1
The ordering of X, Y, maximum value, and minimum value of HD: row is specified as follows in the same way as H2: section in how to read data.
H2: Y = 3.0 TO -3.0 BY -1.0 ; X = -3.0 TO 3.0 BY 1.0 ;
This expression comes from the Fortran expression as,
READ(*,*) ( ( DATA(IX,IY), IX = 1,7,1 ), IY = 7,1,-1 )
H2: { Y \(|\) X } = \(r_1\) TO \(r_2\) BY \(r_3\) ; { X \(|\) Y } = \(r_4\) TO \(r_5\) BY \(r_6\) ;
If you want to exchange X axis and Y axis, the order of reading data has to be exchanged. (In above Fortran expression, the ordering of IX, IY is exchaged.) The “;” of the end of X axis part and Y axis part is always necessary. The number of the numerical data in a line is free as far as the data sequence is satisfied following the above expression.
2.12.2. Parameters for the cluster plot
The size, height and colors of the cluster can be changed in the parameter section P:.
parameters |
explanation |
|---|---|
|
Specify the size of the cluster. By default, the maximum value fills the entire rectangle, and the other values fill the area proportional to the height of the data relative to the maximum value. \(f = 1\) (default) means that the entire rectangle is filled by the cluster, and the value of \(f\) specifies the size of the rectangle for the maximum value. |
|
The size of the cluster is determined proportional to the height of the data in linear scale (default), |
|
The size of the cluster is determined proportional to the height of the data in logarithmic scale. |
|
Set \(dmax\) as the maximum value, neglect the data which values are greater than \(dmax\). |
|
Set \(dmin\) as the minimum value, neglect the data which values are smaller than \(dmin\). |
|
Display the data which value is greater than \(cmax\) in size of the \(cmax\). |
|
Display values smaller than \(cmin\) using the size corresponding to \(cmin\). |
|
Set the cluster color to \(c\) [1]. |
2.12.3. The graph including positive and negative data
When 3D data contains positive and negative numbers, the size of the cluster is drawn in proportion to the size of the absolute value. At that time, the negative numbers are plotted in grayscale to distinguish it from the positive number.
Even when coloring with CLHD, negative number is plotted in complementary colors, so you can distinguish it from positive number.
The following example is a color drawing of data containing negative numbers.
In addition, CLUS is used to scale the maximum size by a factor of 0.7.
List 2.18 • Two dimensional cluster plot, example 2
1:  P: CLHD(R) CLUS(0.7)
2:  HD: Y = 3.0 TO -3.0 BY -1.0 ; X = -3.0 TO 3.0 BY 1.0 ;
3:   0    0    0    0    0    0    0
4:   0   -8   -1    2    4    0    0
5:   0   -2    1    5    6    2    0
6:   0    2    4   14   15    9    0
7:   0    2    5   23   32   12    0
8:   0    0    3   10   16    8    0
9:   0    0    0    0    0    0    0
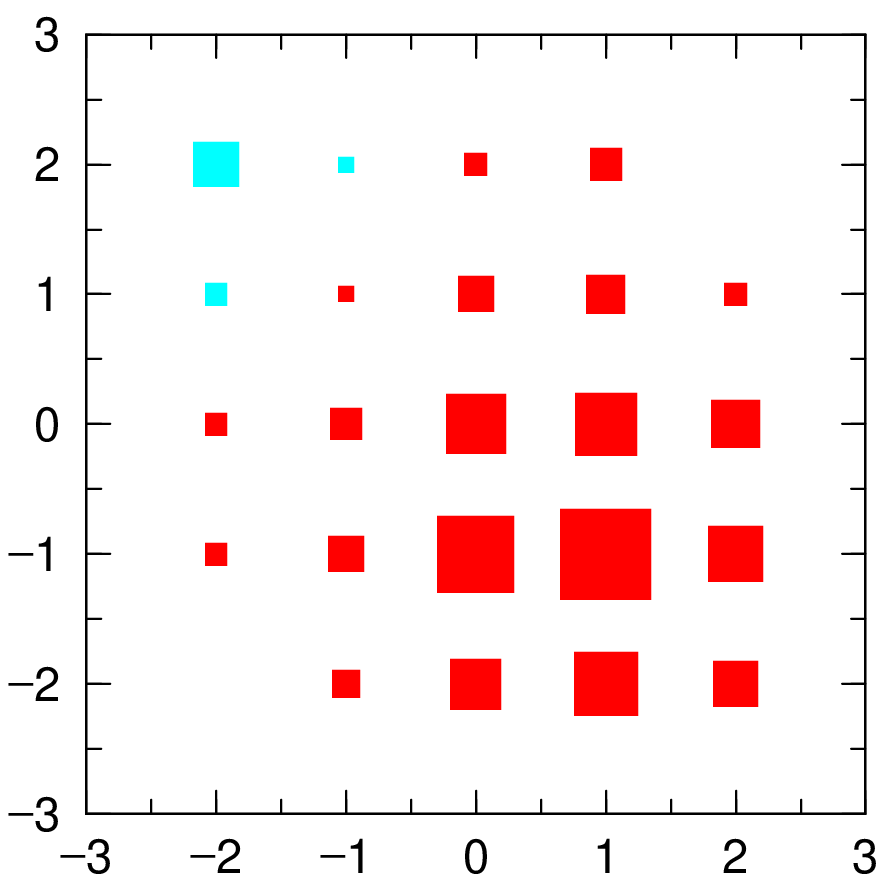
Fig. 2.14 Two dimensional cluster plot, example 2