2.5. INPS: Inserting EPS graph
INPS: { \(file.name\) } X( \(x\) ) Y( \(y\) ) IX( \(ix\) ) IY( \(iy\) ) S( \(s\) ) SX( \(sx\) ) SY( \(sy\) ) A( \(a\) )
You should specify an including EPS file name in { }. ANGEL can support hole inclusion of EPS file and only EPS file with one page and the description of bounding box as %%BoundingBox. The included graph is shown at ( \(x\), \(y\) ), and scaled by \(s\), and also rotated by \(a\) degree if necessary.
2.5.1. INPS: parameters
parameters |
explanation |
|---|---|
|
EPS file name which should be included |
|
\(x\) position of EPS graph (D=origin of x-axis) |
|
\(y\) position of EPS graph (D=origin of y-axis) |
|
Image position relative to the x coordinate
\(ix=1\): left edge (default)
\(ix=2\): horizontal center
\(ix=3\): right edge
|
|
Image position relative to the y coordinate
\(iy=1\): lower edge (default)
\(iy=2\): vertical center
\(iy=3\): upper edge
|
|
Change the scale of EPS by \(s\) (D=1) |
|
Change x-scale of EPS \(sx\) (D=1) |
|
Change y-scale of EPS \(sy\) (D=1) |
|
Rotate EPS by \(a\) degree in counterclockwise (D=0) |
2.5.2. Example of inserting EPS graph
In the following example, we insert an EPS graph at (0,0) rotated by 15 degrees. As we define IX(2) IY(2), the center of graph is located at (0,0) in the original graph. We can draw the frame of EPS graph by using BOX:.
List 2.1 • Example of inserting EPS graph
1:  P: PORT NOMS NOFR NOXT NOYT
2:  P: XMIN(-3) XMAX(3) YMIN(-3) YMAX(3) NOSP FORM(1.0)
3:  P: XDTC(-1) YDTC(-1) AFAC(0.7)
4:  BOX:  BOX(ovalbox) X(0) Y(0) A(15) SX(14) SY(17)
5:  INPS: {tiger.ps}   X(0) Y(0) A(15) IX(2) IY(2) S(0.4)
The following graph is obtained by this input.
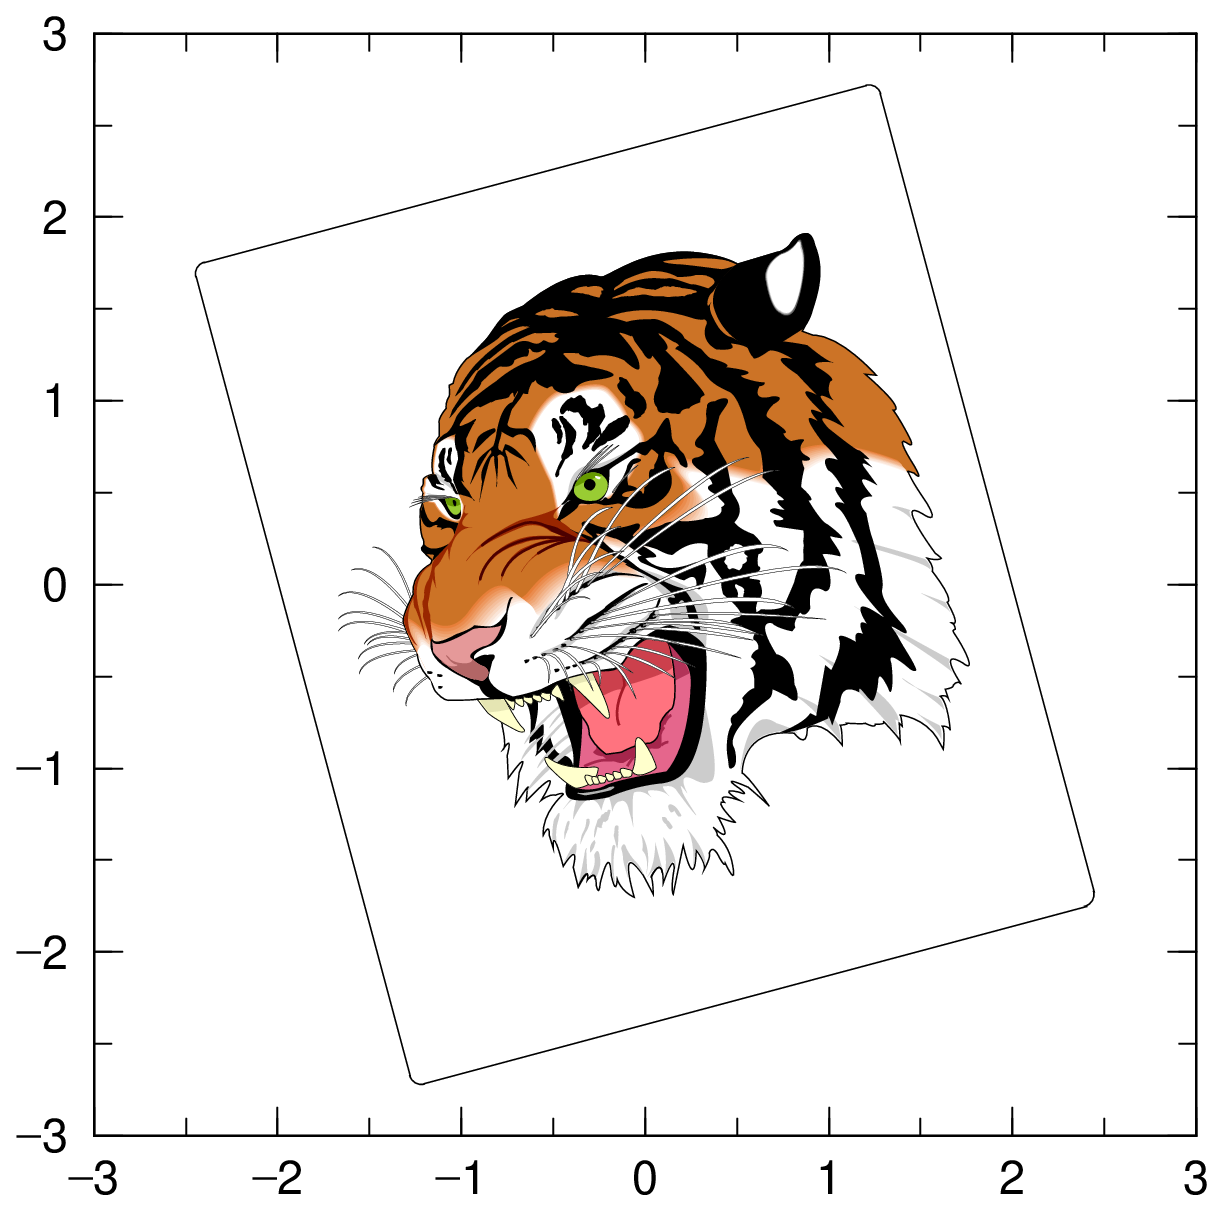
Fig. 2.1 Example of inserting EPS graph