2.13. HC: Two dimensional color cluster plot section
2.13.1. Basic style
HC: section specifes a two-dimensional color cluster plot. A color cluster plot is a plot that fills the area of each mesh with a color proportional to its height from the two-dimensional data given to the two-dimensional equally spaced mesh. The basic style is exactly the same as the H2: section. A color cluster plot of the same data as the contour example gives:
List 2.19 • Two-dimensional color cluster plot, example 1
1:  HC: Y = 3.0 TO -3.0 BY -1.0 ; X = -3.0 TO 3.0 BY 1.0 ;
2:   0    0    0    0    0    0    0
3:   0    8    0    2    4    0    0
4:   0    0    1    5    6    2    0
5:   0    2    4   14   15    9    0
6:   0    2    5   23   32   12    0
7:   0    0    3   10   16    8    0
8:   0    0    0    0    0    0    0
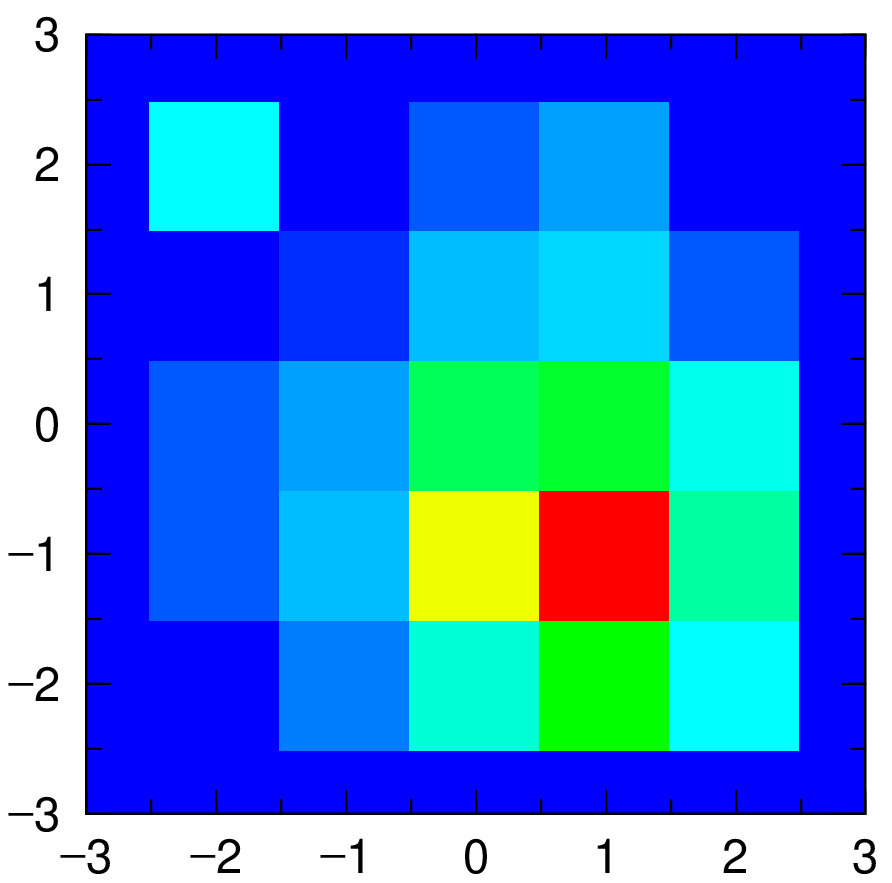
Fig. 2.15 Two-dimensional color cluster plot, example 1
The order of X, Y, maximum value, and minimum value of HD: row is specified as follows in the same way as H2: section in how to read data.
H2: Y = 3.0 TO -3.0 BY -1.0 ; X = -3.0 TO 3.0 BY 1.0 ;
This expression comes from the Fortran expression as,
READ(*,*) ( ( DATA(IX,IY), IX = 1,7,1 ), IY = 7,1,-1 )
H2: { Y \(|\) X } = \(r_1\) TO \(r_2\) BY \(r_3\) ; { X \(|\) Y } = \(r_4\) TO \(r_5\) BY \(r_6\) ;
If you want to exchange X axis and Y axis, the order of reading data has to be exchanged. (In the above Fortran expression, the ordering of IX, IY is exchanged.) The “;” of the end of X axis part and Y axis part is always necessary. The number of the numerical data in a line is free as far as the data sequence is satisfied following the above expression.
2.13.2. Parameters for the color cluster plot
The choice of colors can be changed in the parameter section P:.
parameters |
explanation |
|---|---|
|
The color of the cluster is determined proportional to the height of the data in a linear scale. (default). |
|
The color of the cluster is determined proportional to the height of the data in a logarithmic scale. |
|
Set \(dmax\) as the maximum value, neglect the data which values are greater than \(dmax\). |
|
Set \(dmin\) as the minimum value, neglect the data which values are smaller than \(dmin\). |
|
Display the data which value is greater than \(cmax\) in color of the \(cmax\). |
|
Display the data which value is smaller than \(cmin\) in color of the \(cmin\). |
|
Specify the maximum and minimum color |
|
The default are red(R) and blue(B). |
|
Automatically interpolate by halving the mesh spacing. |
parameter |
Explanation |
|---|---|
|
Specification of Colormap Name
Example: |
|
Usage of discrete color bars and specification of the number of colors.
Example: |
An example of interpolating by adding IPDC to the above example is shown below.
List 2.20 • Two-dimensional color cluster plot, example 2
1:  P: IPDC
2:  HC: Y = 3.0 TO -3.0 BY -1.0 ; X = -3.0 TO 3.0 BY 1.0 ;
3:   0    0    0    0    0    0    0
4:   0    8    0    2    4    0    0
5:   0    0    1    5    6    2    0
6:   0    2    4   14   15    9    0
7:   0    2    5   23   32   12    0
8:   0    0    3   10   16    8    0
9:   0    0    0    0    0    0    0
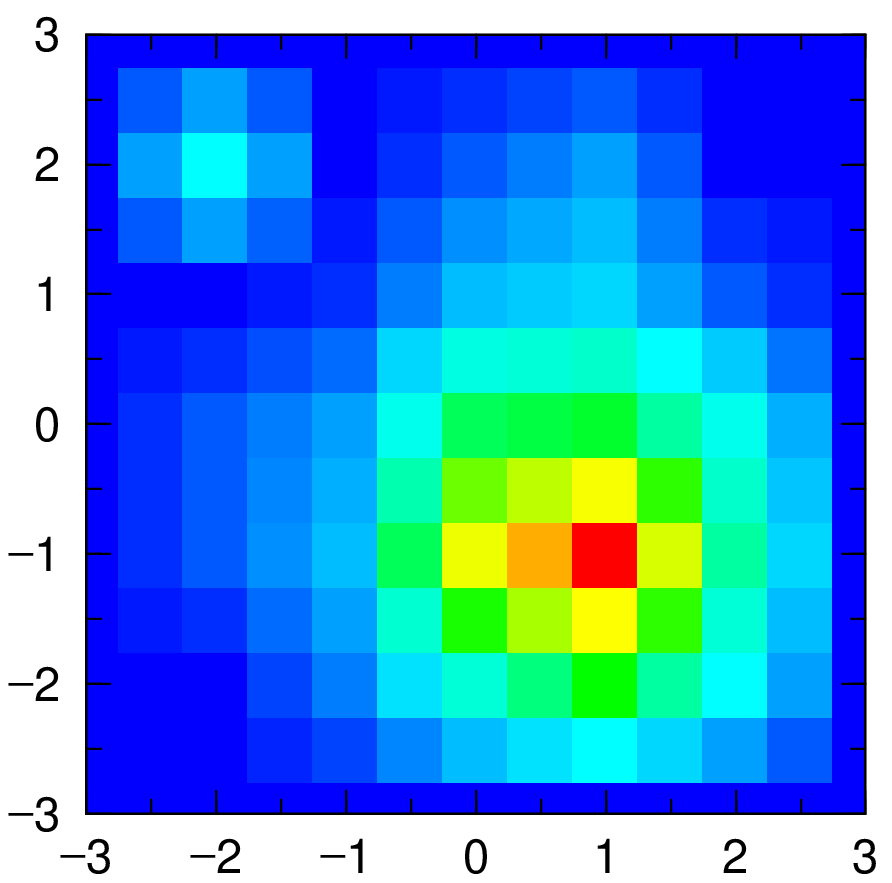
Fig. 2.16 Two-dimensional color cluster plot, example 2
2.13.3. Important point for the plot with ZLOG
When handling data logarithmically, the default minimal is set as \(1 \times 10^{-41}\). From this reason, the zero area cannot be displayed in default setting. If you want to display the zero area in logarithmic plot by blue, Please enter a smaller number than \(1\times 10^{-41}\), such as DMIN(1.0E-42).