7.17. [ T-WWBG ] section
This tally gives parameters used for the [ww bias] section. The tally serves as a Weight Window Bias Generator (WWBG) to automatically obtain effective settings of [ww bias], which is used to bias [weight window]. The [ww bias] function is useful when the [weight window] parameters for a certain region are biased after automatically generating the [weight window] section by [t-wwg]. Fig. 7.17.1 shows a flowchart of how to perform the transport calculation using [weight window] and [ww bias]. First, generate the [weight window] section by [t-wwg]. If the obtained parameters of [weight window] are enough to effectively use the variance reduction technique, the [ww bias] section is not needed. However, if they are not enough, the variance reduction technique can be used more effectively by biasing the [weight window] parameters for a certain region with [ww bias]. There are two methods to set the [ww bias] section: an automatic method using [t-wwbg], which is a Weight Window Bias Generator (WWBG) and is explained below, and a manual method by a user. Only one [t-wwbg] section can be set in one input file. [t-wwbg] is effective only when icntl=15 in [parameters]. For details of [ww bias], see Section 5.21. When performing a transport calculation with [ww bias] and [weight window], set icntl=0 and iwwbias=1 in [parameters].
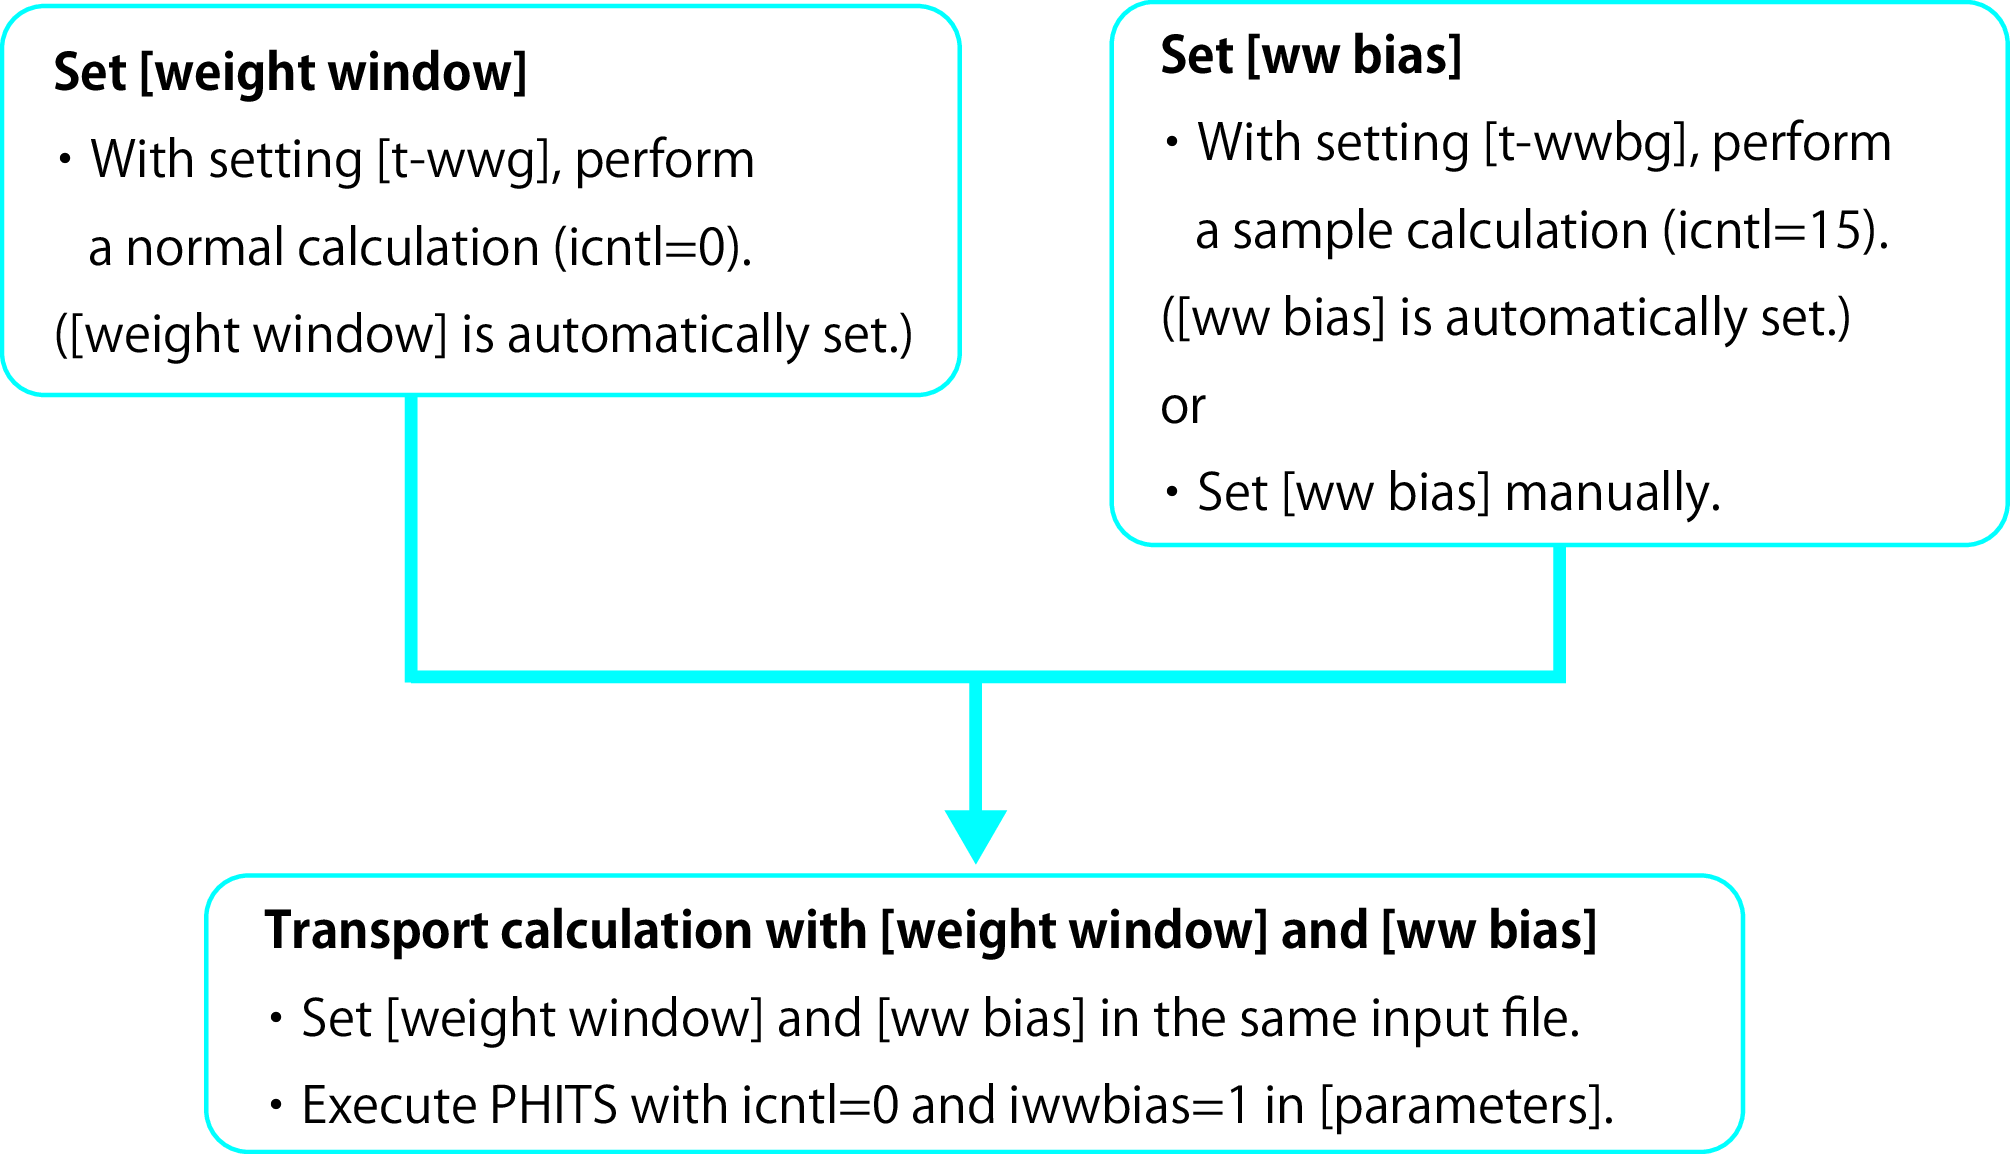
Fig. 7.17.1 The flowchart of the connection calculation between [weight window] and [ww bias].
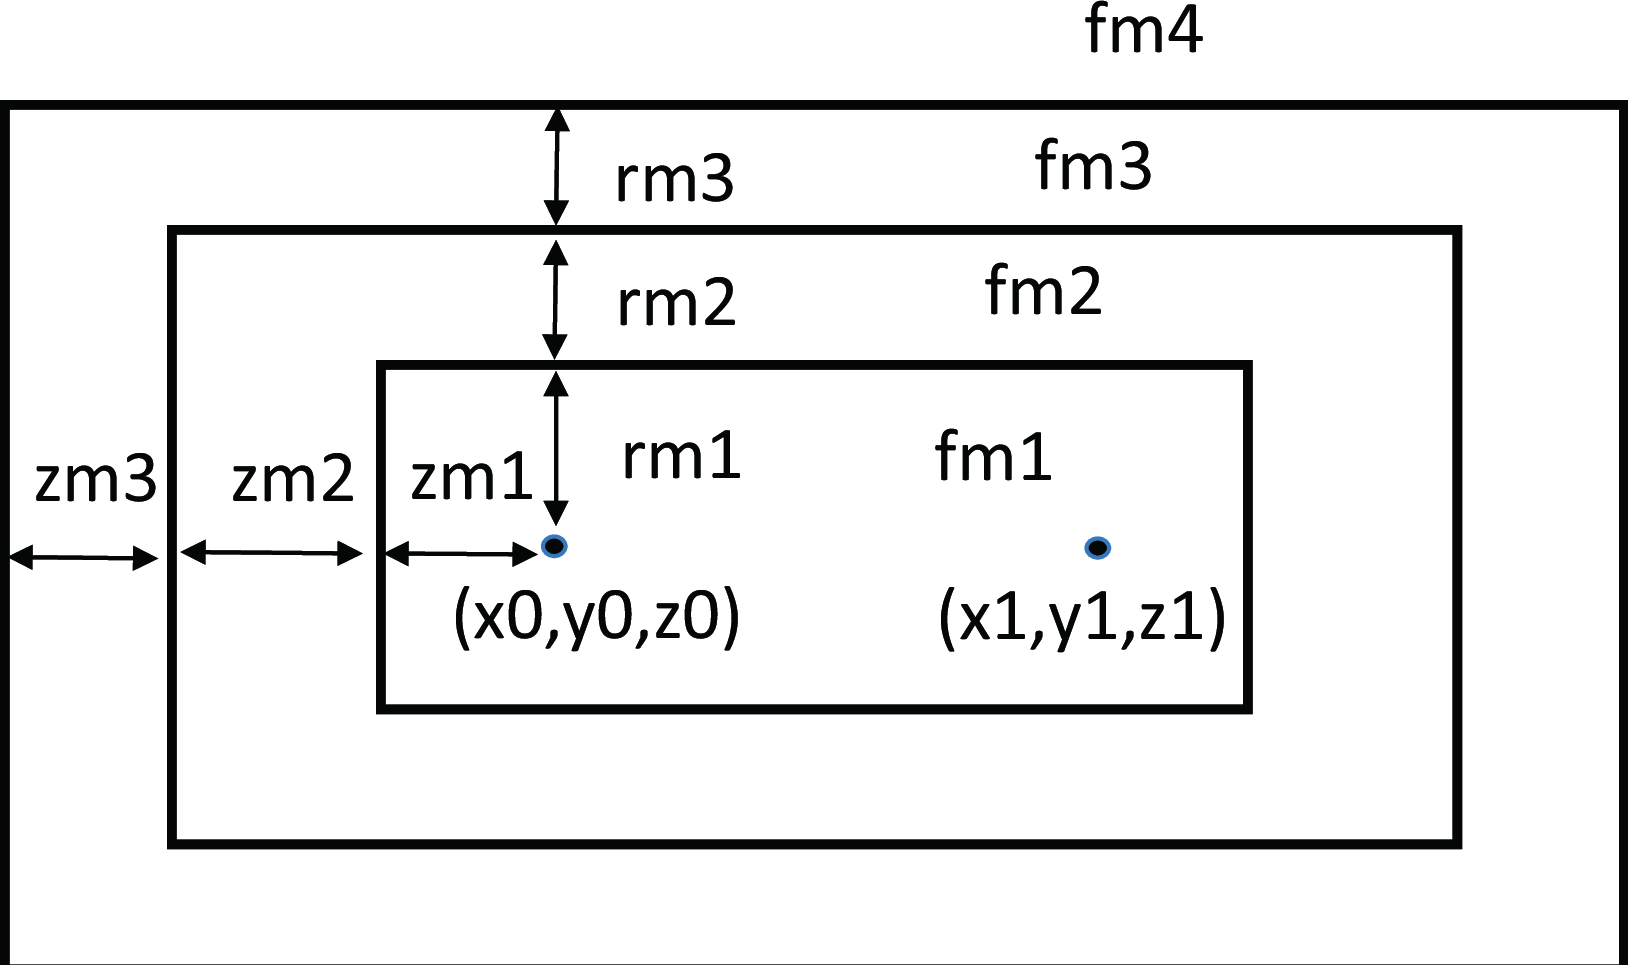
Fig. 7.17.2 Parameters to define cylindrical regions.
[t-wwbg] determines the bias values in stages of some cylindrical regions, which are with a central axis on a vector defined by two points (x0,y0,z0) and (x1,y1,z1), shown in Fig. 7.17.2. Fig. 7.17.2 shows a cross-section view of three different size cylinders. To define the cylindrical regions, the parameters n-mesh, r-mesh, z-mesh, and f-mesh are also required. n-mesh is the number of the cylinders. The differences of radii and heights of the cylinders are given by r-mesh and z-mesh, respectively. In these parameters, the same number of values as n-mesh must be given. The bias values can be set from the inside of the cylindrical regions in f-mesh. f-mesh must be set to (n-mesh)+1. The last value of f-mesh is the bias value in the outside of the cylinders. The cylindrical regions can be defined regardless of the geometry of the particle transport simulation. Note that if the defined cylindrical regions overlap the outer void given in [cell], the outer void region can be extended by the r-out parameter.
The [t-wwbg] parameters are formatted as follows.
value |
explanation |
reg, xyz, tet |
Mesh type. Only reg, xyz, and tet can be set. A mesh type subsection is required below this option. |
value |
explanation |
all (default), particle name |
Tally particle. |
value |
explanation |
1, 2, 3, 4, 5 |
Energy mesh. See Section 6.6.1 for mesh subsection format. |
value |
explanation |
1, 2, 3, 4, 5 (optional) |
Time mesh. See Section 6.6.1 for mesh subsection format. |
value |
explanation |
xy, yz, xz, wwbg |
Restart calculation cannot be performed. When xy, yz, or xz is selected, the rshow option is needed. |
value |
explanation |
|
Define output file names. This is required by each setting of axis. |
value |
explanation |
(optional) |
ANGEL parameters. |
value |
explanation |
(optional) |
\(x\) axis title. |
value |
explanation |
(optional) |
\(y\) axis title. |
value |
explanation |
(optional) |
\(z\) axis title. |
value |
explanation |
0 (default), 1, 2, 3 |
When mesh=xyz and axis=xy,yz,xz, region border (1), material name (2), and region name (3) are plotted using this option. A xyz mesh section must be added below this option. |
value |
explanation |
1 (default) |
This option multiplies the region line resolution by a factor of resol with the rshow option set to define the line thickness. |
value |
explanation |
0.5 (default) |
The option defines the line thickness. |
value |
explanation |
0 (default), 1 |
When epsout=1, results are plotted into eps files.
The eps file is named by replacing the extension with |
value |
explanation |
x, y, z coordinates of an initial point. |
value |
explanation |
x, y, z coordinates of a terminal point. |
value |
explanation |
n |
The number of cylindrical regions. |
value |
explanation |
rm1, rm2, …, rmn |
The differences of radii of cylinders. The number of n-mesh values must be set. If the list does not fit on one line, it can be split across multiple lines without using the line-connection symbol. |
value |
explanation |
zm1, zm2, …, zmn |
The differences of heights of cylinders. The number of n-mesh values must be set. If the list does not fit on one line, it can be split across multiple lines without using the line-connection symbol. |
value |
explanation |
fm1, fm2, …, fmn, fm(n+1) |
Bias values in cylindrical regions. The number of (n-mesh)+1 values must be set. If the list does not fit on one line, it can be split across multiple lines without using the line-connection symbol. |
value |
explanation |
(omissible, D=0) |
Radius to extend the outer void [cm]. |
The same region specifications are required to use [ww bias] with [weight window] and therefore the same region definitions are required between [t-wwg] and [t-wwbg] to create [weight window] automatically using [t-wwg].
The following is an example of [t-wwbg].
     1:   [ T - WWBG ]
     2:        mesh =  xyz
     3:      x-type =   2
     4:          nx =  30
     5:        xmin = -75
     6:        xmax =  75
     7:      y-type =   2
     8:          ny =  30
     9:        ymin = -75
    10:        ymax =  75
    11:      z-type =   2
    12:          nz =  40
    13:        zmin =   0.0
    14:        zmax = 200
    15:        axis = wwbg
    16:        file = wwbg.out
    17:        part =  neutron
    18:      e-type =   1
    19:          ne =   2
    20:               0.0  1e-3  1.0
    21:          x0 =  0.0
    22:          y0 = -20
    23:          z0 =  50
    24:          x1 =  0.0
    25:          y1 =  20
    26:          z1 =  150
    27:      n-mesh =   3
    28:      r-mesh =   10  10  10
    29:      z-mesh =   10  10  10
    30:      f-mesh =   1.0  0.5  0.1  0.05
    31:       r-out =  1000
In this example, the initial and terminal points are (0, -20, 50) and (0, 20, 150), respectively. The three cylindrical regions are defined with the central axis on the vector defined by the two points. Fig. 7.17.3 shows a spatial distribution of the bias values given by the example input. The radii of the three cylinders are defined by r-mesh, and the differences of them are 10 cm. The heights of the cylinders increase by 20 cm, which is two times the 10 cm given by z-mesh. Bias values are given as 1.0, 0.5, 0.1, and 0.05 from the inside of the cylindrical regions. The change of the biases is shown in Fig. 7.17.3.
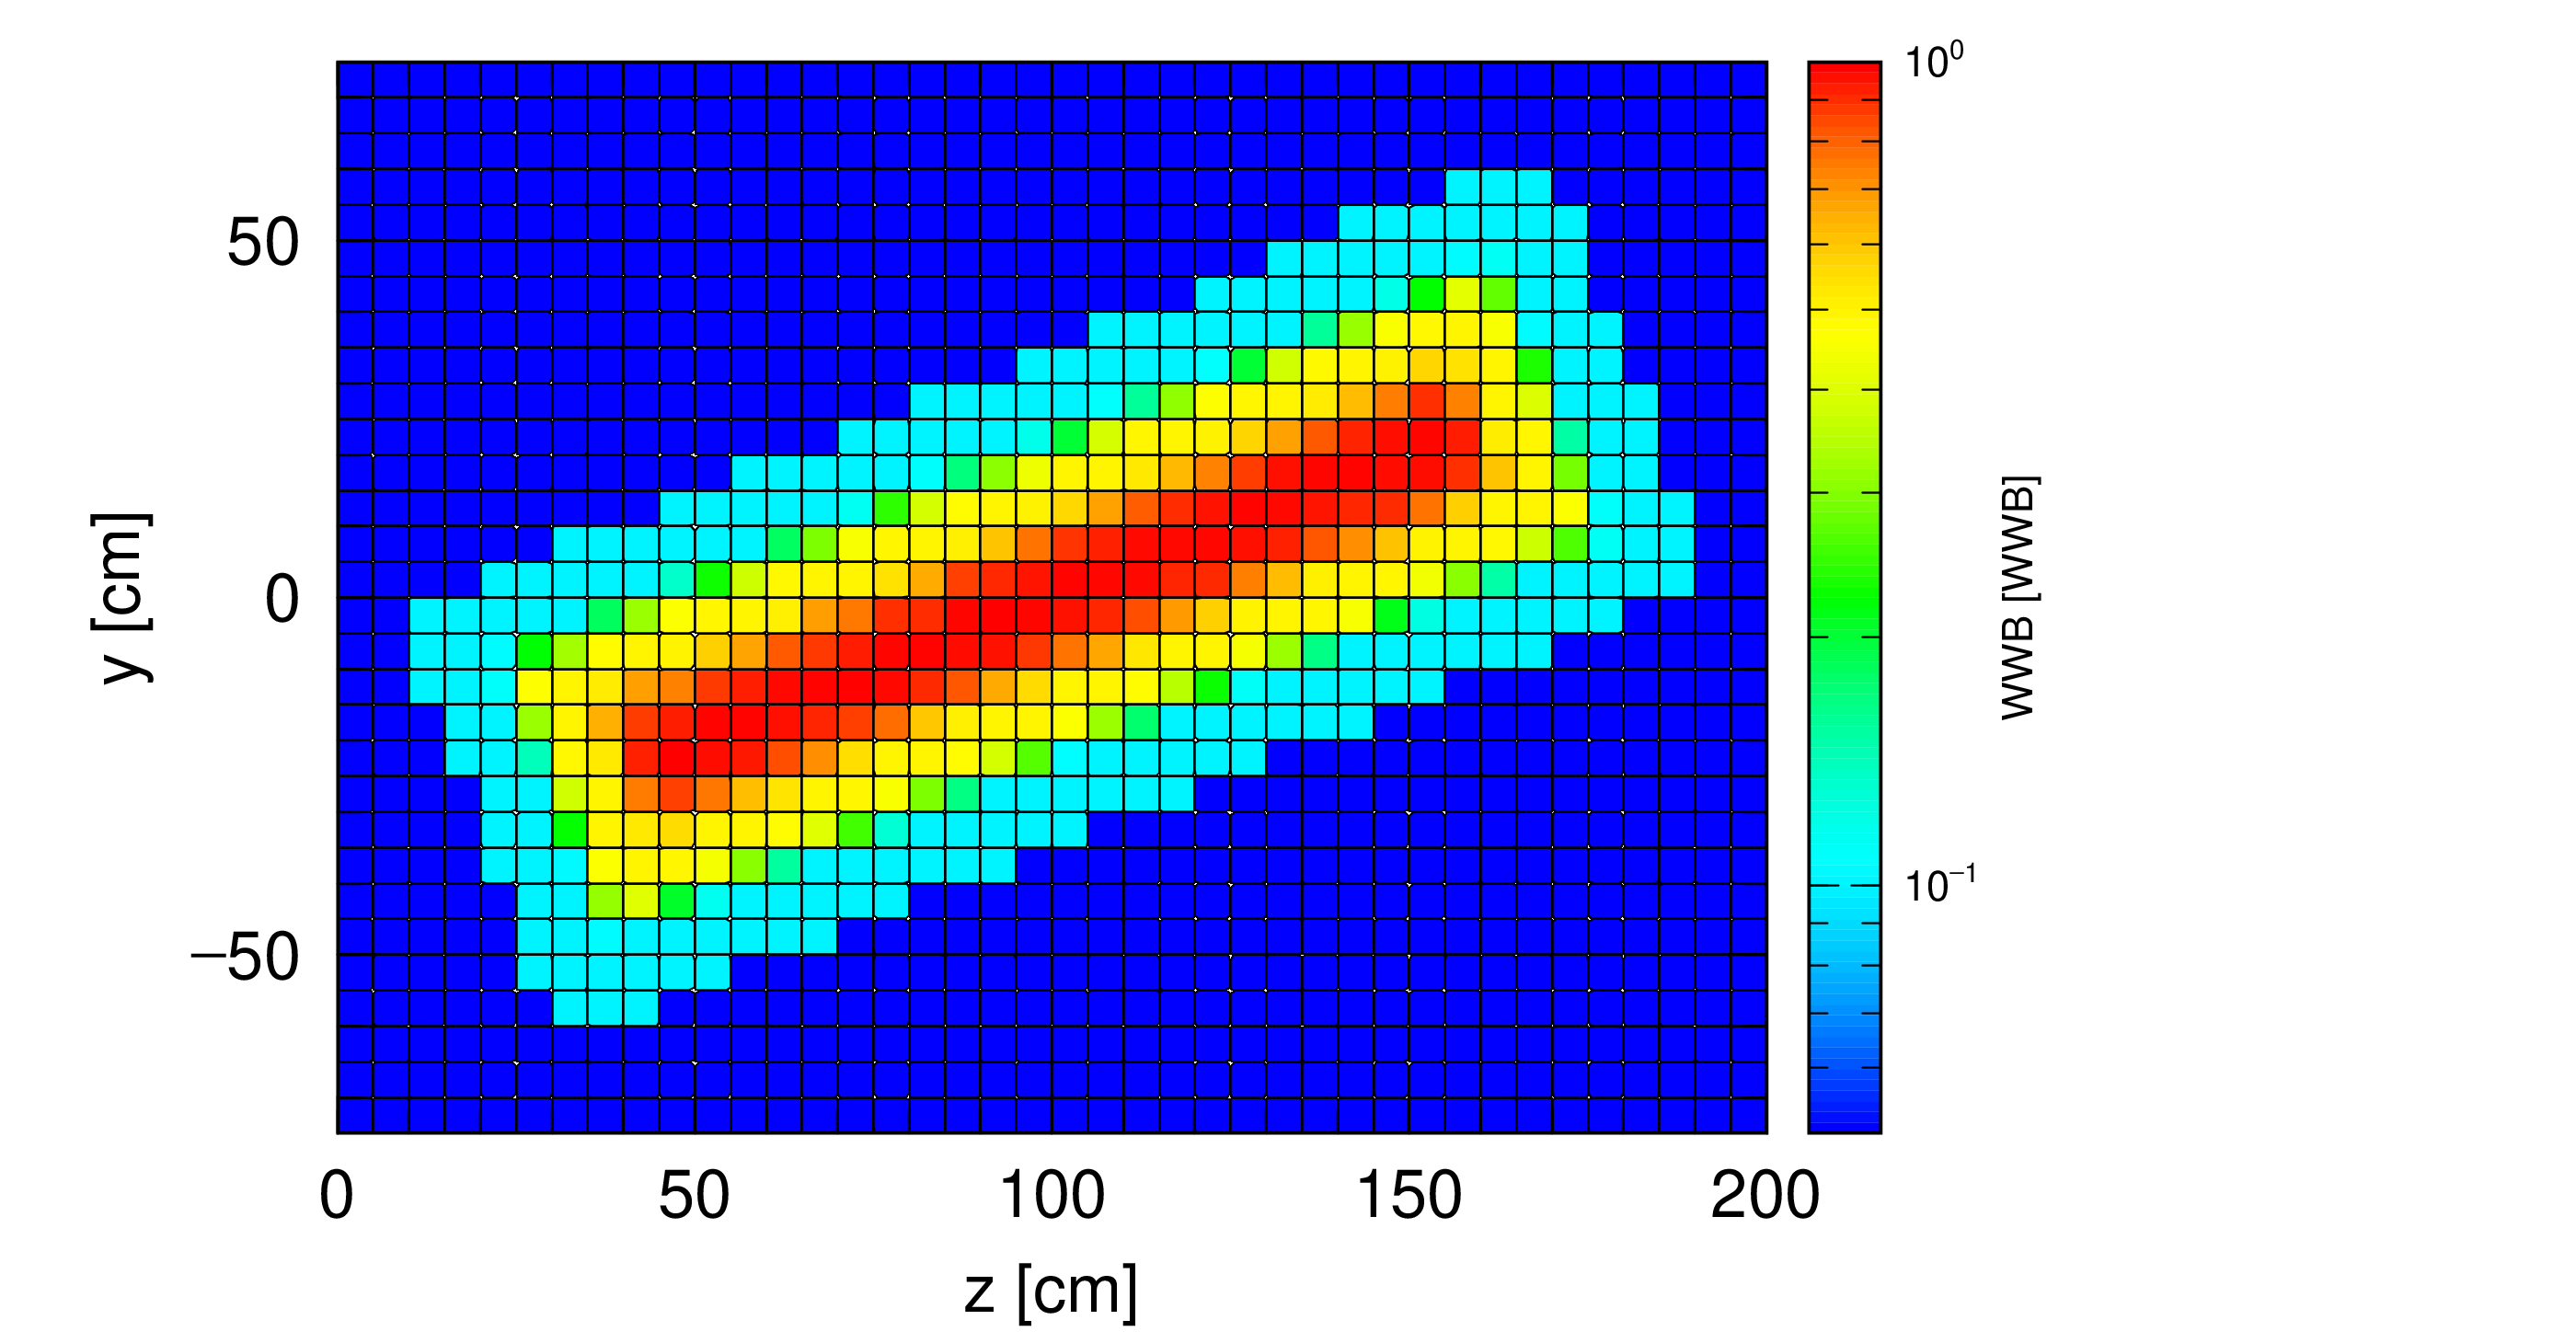
Fig. 7.17.3 Spatial distribution of bias values given by the example of [t-wwbg].