7.21. [ T-Rshow ] section
This tally produces graphical geometry output for regions bounded by xyz mesh with color plotting in proportion to physical quantities of the regions. Usually, this tally uses results obtained by a PHITS calculation with reg mesh as input data to display the distribution of the physical quantity. These outputs can be obtained without transport calculation using the option icntl=9 in the [parameters] section.
A scale of the color gradation can be changed by setting ANGEL parameters zlog and zlin to log and linear scales, respectively. The default setting is zlin.
value |
explanation |
xyz |
Mesh type. Only xyz mesh can be set. A mesh type subsection is required below this option. |
value |
explanation |
xy, yz, xz |
2-dimensional. |
value |
explanation |
|
Define output file names. This is required by each setting of axis. |
value |
explanation |
1 |
Region boundary. |
2 |
Region boundary + material name. |
3 |
Region boundary + region name. |
4 |
Region boundary + LAT number. |
value |
explanation |
1 (default) |
This option multiplies the region line resolution by a factor of resol. |
value |
explanation |
0.5 (default) |
The option defines the line thickness. |
value |
explanation |
(optional) |
Title. |
value |
explanation |
(optional) |
ANGEL parameters. |
value |
explanation |
(optional) |
Special format for ANGEL parameters. |
value |
explanation |
(optional) |
\(x\) axis title. |
value |
explanation |
(optional) |
\(y\) axis title. |
value |
explanation |
(optional) |
\(z\) axis title. |
value |
explanation |
reg |
Region definition. |
value |
Value definition. |
reg val |
Value definition with the same format as volume definition. For details see the [volume] section. |
value |
explanation |
|
Maximum number of columns for volume input echo. |
value |
explanation |
0 (default), 1 |
Results are plotted into eps files.
This eps file is named by replacing the extension into |
value |
explanation |
0 (default), 1 |
Generate Bitmap figure of 2-dimensional tally output.
This file is named by replacing the extension with |
value |
explanation |
(optional) |
Coordinate transformation number or definition for r-z or xyz mesh. |
value |
explanation |
2 (default) |
Option to draw lattice or tetrahedral geometry boundary lines when gshow or rshow is specified. |
0 |
Not drawing. |
1 |
Drawing. Note that the line of voxel phantoms may not be drawn clearly. |
2 |
Not drawing the lines in the same cell. |
3 |
Not drawing the lines in the same material. In this case, the boundary of two adjacent cells filled with the same material is not also drawn, even if not lattice or tetrahedral geometry. When gshow>=3, cell and lattice numbers are now shown. |
For example, Fig. 7.21.1 can be obtained by the [t-rshow] tally shown below from example (6) shown in Section 5.6.4.
     1:   [ T - rshow ]
     2:        mesh = xyz
     3:      x-type = 2
     4:          nx = 100
     5:        xmin = -10.
     6:        xmax =  10.
     7:      y-type = 1
     8:          ny = 1
     9:              -5.0  5.0
    10:      z-type = 2
    11:          nz = 100
    12:        zmin = -10.
    13:        zmax =  10.
    14:        axis = xz
    15:      output = 1
    16:        file = cell-example6-rshow.dat
    17:      epsout = 1
    18:         reg = (201<101[-1 1 0]<1) (201<101[0 1 0]<1) (201<101[1 1 0]<1)
    19:              (201<101[-1 0 0]<1) (201<101[0 0 0]<1) (201<101[1 0 0]<1)
    20:              (201<101[-1 -1 0]<1) (201<101[0 -1 0]<1) (201<101[1 -1 0]<1)
    21:       value
    22:      non     reg      val     # reg definition
    23:       1  1000001   1.0000E+00 # ( 201 < 101[ -1 1 0 ] < 1 )
    24:       2  1000002   2.0000E+00 # ( 201 < 101[ 0 1 0 ] < 1 )
    25:       3  1000003   3.0000E+00 # ( 201 < 101[ 1 1 0 ] < 1 )
    26:       4  1000004   4.0000E+00 # ( 201 < 101[ -1 0 0 ] < 1 )
    27:       5  1000005   5.0000E+00 # ( 201 < 101[ 0 0 0 ] < 1 )
    28:       6  1000006   6.0000E+00 # ( 201 < 101[ 1 0 0 ] < 1 )
    29:       7  1000007   7.0000E+00 # ( 201 < 101[ -1 -1 0 ] < 1 )
    30:       8  1000008   8.0000E+00 # ( 201 < 101[ 0 -1 0 ] < 1 )
    31:       9  1000009   9.0000E+00 # ( 201 < 101[ 1 -1 0 ] < 1 )
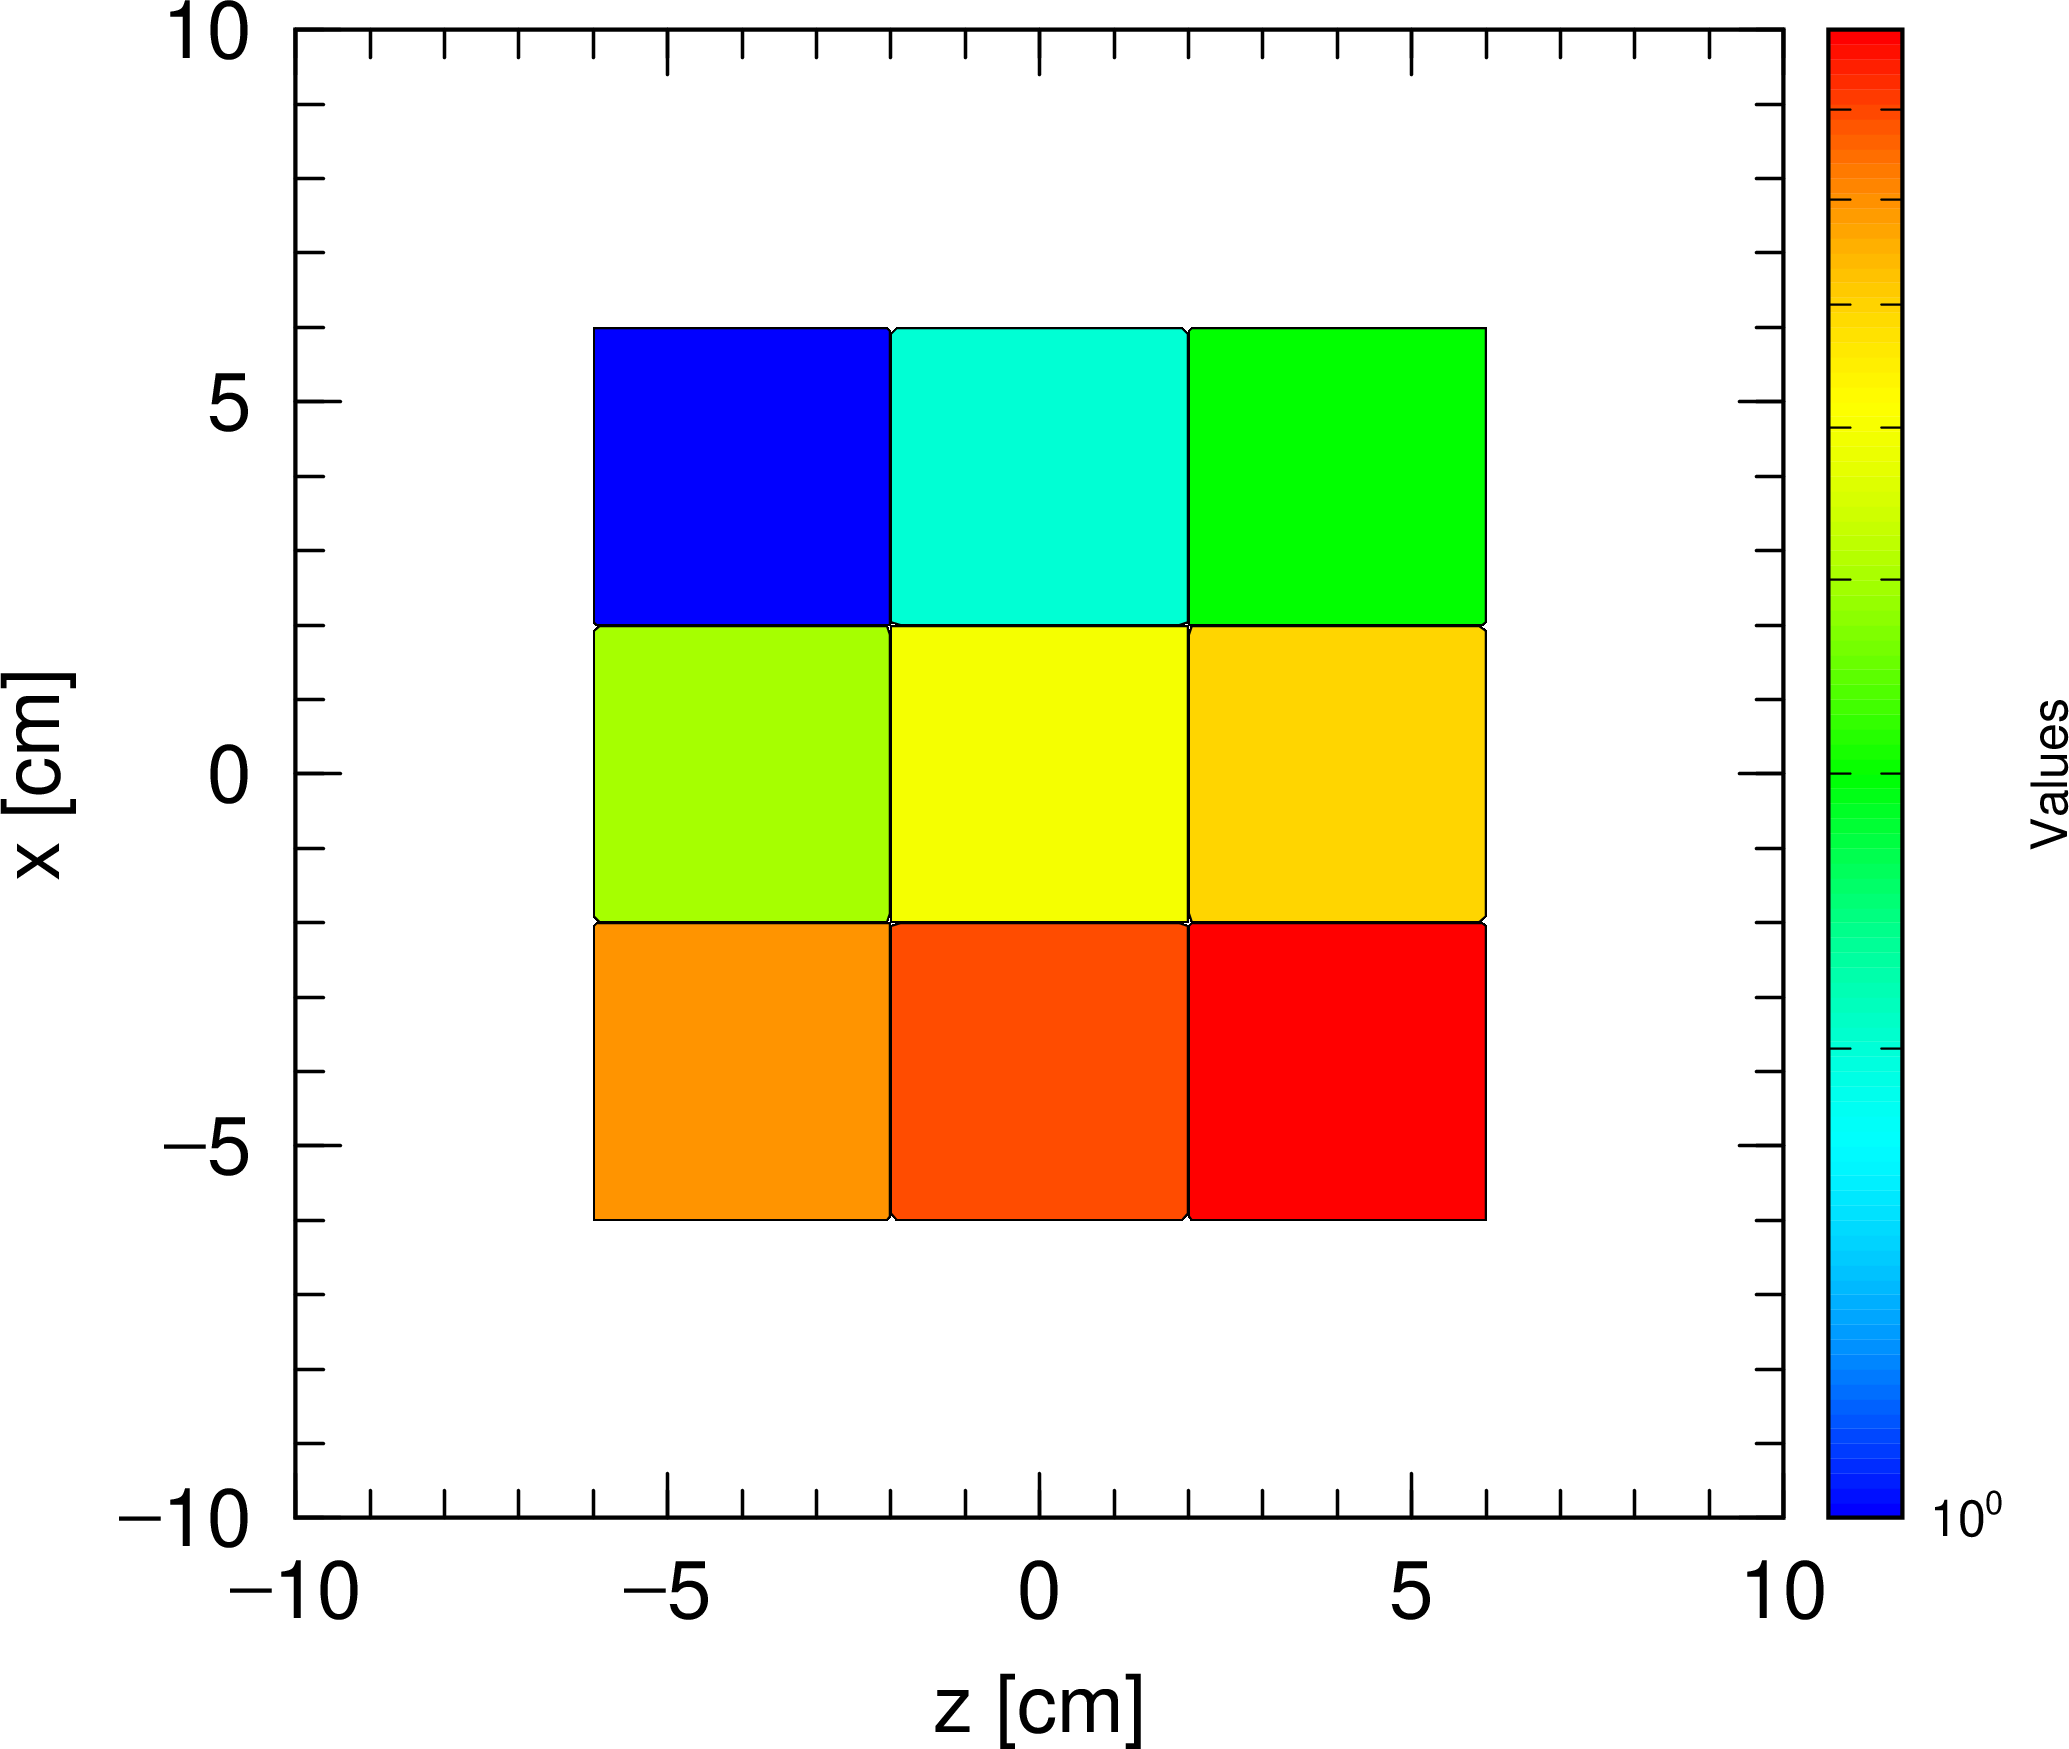
Fig. 7.21.1 Example of [t-rshow].