7.22. [ T-3Dshow ] section
This tally produces graphical geometry output by 3-dimensional view. This tally can be generated without transport calculation using the option icntl=11 in the [parameters] section.
value |
explanation |
0 |
Draft. |
1 |
Only region boundary. |
2 |
Without region boundary. |
3 (default) |
Region boundary + color. |
value |
explanation |
(optional) |
Specify materials for display. |
all |
all is the default, same as no definition. |
number of materials |
To set number of materials, define the material numbers in the next line. The number of materials can be set as a negative value; in this case the specified materials are not included for display. |
(next line) |
2 5 8 Material numbers. |
value |
explanation |
(D=0.0) |
Coordinates of focal point. Center of screen is defined by this point and the eye point. |
value |
explanation |
(D=80) |
Polar angle of coordinates of the eye point, \(\theta\), from the focal point [degree]. |
value |
explanation |
(D=140) |
Azimuthal angle of coordinates of the eye point, \(\phi\), from the focal point [degree]. |
value |
explanation |
(D=w-dst*10) |
Distance between the eye point and the focal point [cm]. |
value |
explanation |
(D=e-the) |
Polar angle of coordinates of the light source, \(\theta\), from the focal point [degree]. |
value |
explanation |
(D=e-phi) |
Azimuthal angle of coordinates of the light source, \(\phi\), from the focal point [degree]. |
value |
explanation |
(D=e-dst) |
Distance between the light source and the focal point [cm]. |
value |
explanation |
(D=100) |
Width of screen frame [cm]. |
value |
explanation |
(D=100) |
Height of screen frame [cm]. |
value |
explanation |
(D=200) |
Screen frame distance from the focal point [cm]. A straight line drawn between the center of the screen frame and the focal point crosses the screen surface vertically, and passes through the eye point. |
value |
explanation |
(D=100) |
Number of meshes in horizontal direction. |
value |
explanation |
(D=100) |
Number of meshes in vertical direction. |
value |
explanation |
(D=0.0) |
Angle of frame [degrees]. |
value |
explanation |
(D=y) |
Topside direction. Set x, -x, y, -y, z, or -z. |
value |
explanation |
(D=0) |
-1: Mirror transformation in horizontal direction. |
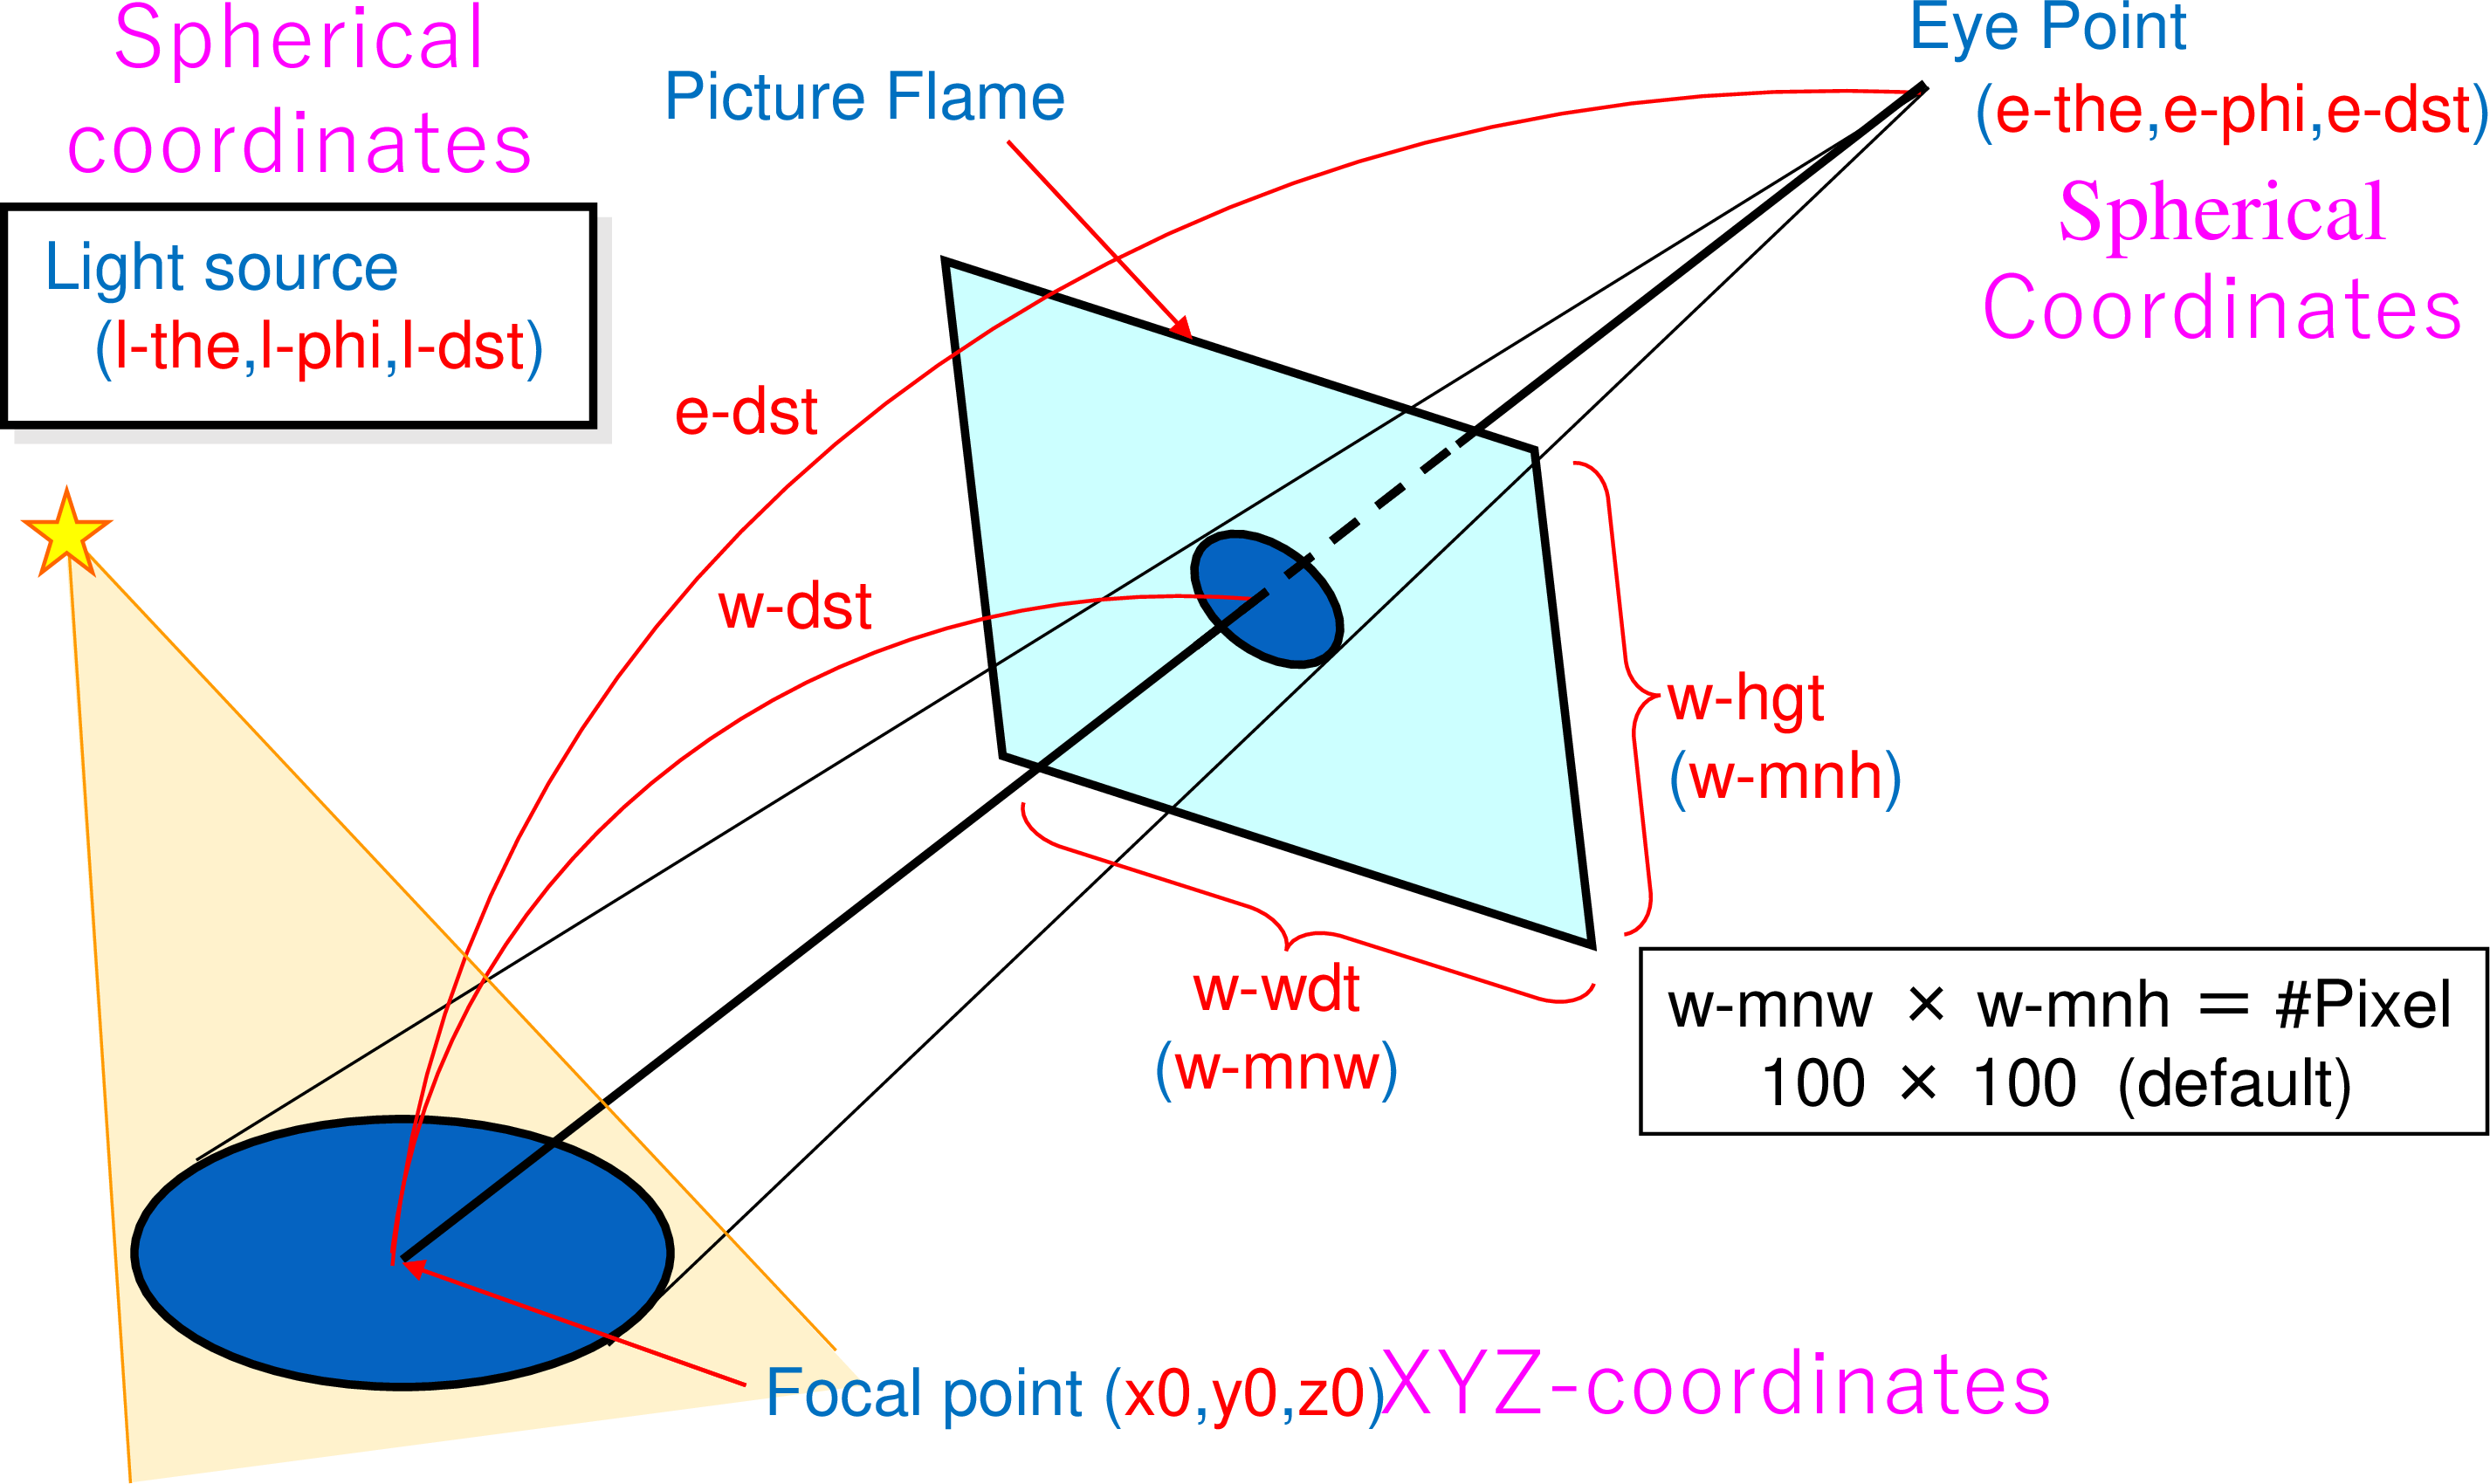
Fig. 7.22.1 3dshow tally: focal point (x0,y0,z0), eye point (e-the,e-phi,e-dst), light source (l-the,l-phi,l-dst), and picture frame (w-wdt,w-hgt,w-dst).
value |
explanation |
0 (default), 1 |
When output=1 or 3: 0: material boundary + surface boundary. 1: material boundary + surface boundary + region boundary. |
value |
explanation |
(D=50000) |
Radius of outer void including eye point, and light source [cm]. |
value |
explanation |
(D=0) |
Shadow level. 0 means no shadow, and 2 is recommended. |
value |
explanation |
(D=0.8) |
Brightness limit. 1 means maximum and 0 means no brightness. |
value |
explanation |
(D=0.2) |
Darkness limit. 1 means no darkness and 0 means maximum. |
value |
explanation |
(D=0) |
Number of penetrations per box. Maximum is 5. |
10 numbers |
Box definition, see below. |
value |
explanation |
(optional) |
Materials in the box for display. |
all |
all is the default, same as no definition. |
number of materials |
If number of materials is set, material numbers should be defined in the next line. The number of materials cannot be set as negative. |
(next line) |
2 5 8 Material numbers. |
value |
explanation |
(optional) |
Regions in the box for display. |
all |
all is the default, same as no definition. |
region numbers |
If matinbox is defined for a region, the region is not displayed. |
value |
explanation |
1 (default) |
This option multiplies the region line resolution by a factor of resol. |
value |
explanation |
0.5 (default) |
The option defines the line thickness. |
value |
explanation |
|
Define file names. |
value |
explanation |
(optional) |
Title. |
value |
explanation |
(optional) |
ANGEL parameters. |
value |
explanation |
(optional) |
Special format for ANGEL parameters. |
value |
explanation |
(optional) |
\(x\) axis title. |
value |
explanation |
(optional) |
\(y\) axis title. |
value |
explanation |
(optional) |
\(z\) axis title. |
value |
explanation |
0 (default), 1 |
Results are plotted into eps files.
This eps file is named by replacing the extension into |
value |
explanation |
(D=1) 0, 1, 2 |
0: No. Axis not shown. 1: Small axis is shown in the lower-left of the figure. 2: Large axis is shown in the center of the figure. |
The definitions of the rules for reg= and reginbox= are the same as that for the region mesh in Section 6.1.1.
To save calculation time, an outer void defined by the radius r-out has been introduced. A larger r-out value must be used when using a large geometry or when placing the light source and eye point at long distances. As this new outer void definition can be seen in input echo, input echo cannot be used by icntl=11 as an input for the next calculation.
No shadow is created if the eye point and light source are set in the same position.
7.22.1. Box definition
A maximum of five penetration boxes can be defined; defined boxes become transparent. To define a box, three points must first be set as b0**(x0,y0,z0), **b1**(x1,y1,z1), and **b2**(x2,y2,z2), respectively. The fourth point **b3 from b0 is defined to lie L cm in the vertical direction of the plane defined by these three points, that is, in the (b2 - b0) direction. In the box definition, a coordinate transformation such as trcl= transform number or trcl = (……..) can be used prior to the definition of the points.
This function may fail when a void region is included in the penetration box; in this case, the user should fill the void region with a material of very low density, for example air.
The box definition is shown below. Each relation is also shown in Fig. 7.22.2.
      box = 2
      box   x0  y0  z0
            x1  y1  z1
            x2  y2  z2  L
      box   trcl = 2
            x0  y0  z0
            x1  y1  z1
            x2  y2  z2  L
      box   *trcl = (0 0 0  0 90 90  90 60 150  90 30 60  -1)
            0.0  0.0  0.0
           -5.0  0.0  0.0
            0.0  0.0  5.0   5.0
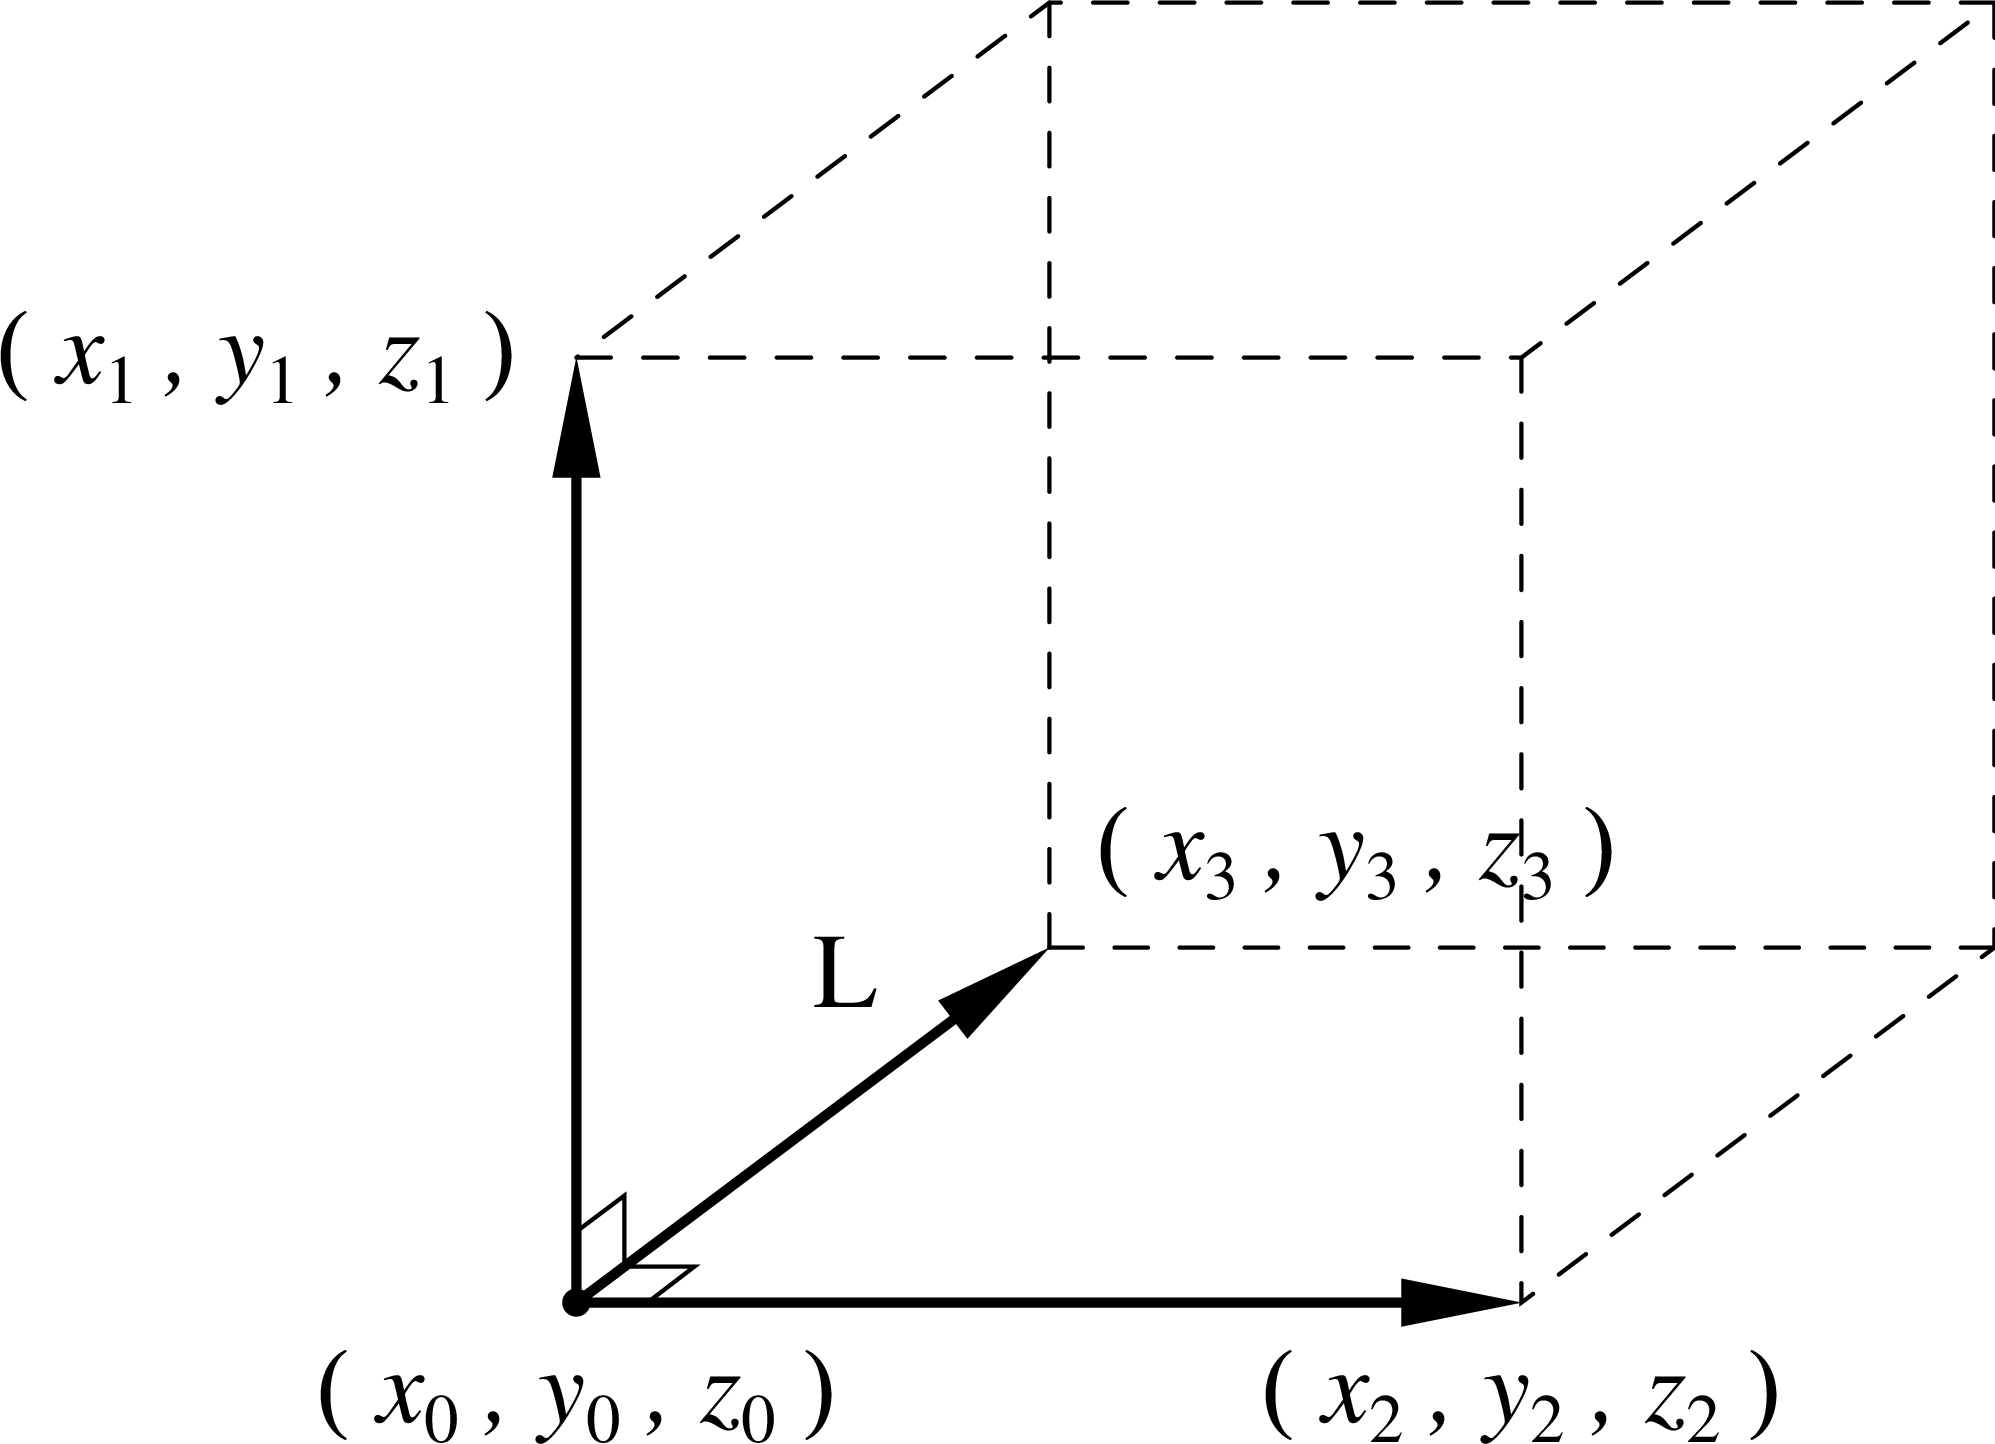
Fig. 7.22.2 Example of box definition.
7.22.2. 3dshow example
     1:  [cell]
     2:      1  0 -1 fill=1
     3:      2  0 -41 42 -43 44 -45 46  u=1 fill=5
     4:     22  0 -41 42 -43 44 -45 46  u=1 trcl=(0 0 20) fill=6
     5:     23  like 22 but trcl=(0 0 40) fill = 7
     6:      5  0 -21 22 -23 24 -25 26  u=5 lat=1 fill=3
     7:      6  0 -21 22 -23 24 -25 26  u=6 lat=1 fill= -1:1 0:0 0:0  2 2(0 0 5) 2
     8:      7  0 -21 22 -23 24 -25 26  u=7  fill= -1:1 0:0 0:0  2 3 2 lat=1
     9:      3  1  3.97300E-02  3 u=2
    10:      4  6  4.18280E-02 -3 u=2
    11:     13  5  8.47130E-04 -3 u=3
    12:     14  3  1.23620E-01  3 u=3
    13:      8  -1 +1
    14:  [surface]
    15:      1   rpp -15 15 -5 5  -5 55
    16:      21   px    5
    17:      22   px   -5
    18:      23   py    5
    19:      24   py   -5
    20:      25   pz   15
    21:      26   pz   -5
    22:      41   px   15
    23:      42   px  -15
    24:      43   py    5
    25:      44   py   -5
    26:      45   pz   15
    27:      46   pz   -5
    28:      5   rpp -20 20 -5 5 -5 35
    29:      6   rpp -20 20 -5 5 -5 15
    30:      7   rpp -20 20 -5 5 35 55
    31:      3   c/y   0 10  4
In the above geometry, the overall body is a rectangular solid with rectangular solid lattices including cylinders on the interior. A graphical plot for the geometry can be created using 3dshow as follows.
     1:  [t-3dshow]
     2:     output = 3
     3:     heaven = x
     4:     resol = 2
     5:     width = 0.1
     6:     x0 =  0
     7:     y0 =  0
     8:     z0 = 25
     9:     e-the = 70
    10:     e-phi = 50
    11:     e-dst = 1000
    12:     l-the = 50
    13:     l-phi = 25
    14:     l-dst = 2000
    15:     w-wdt = 60
    16:     w-hgt = 40
    17:     w-dst = 150
    18:     file = dshow.dat
The output result is then
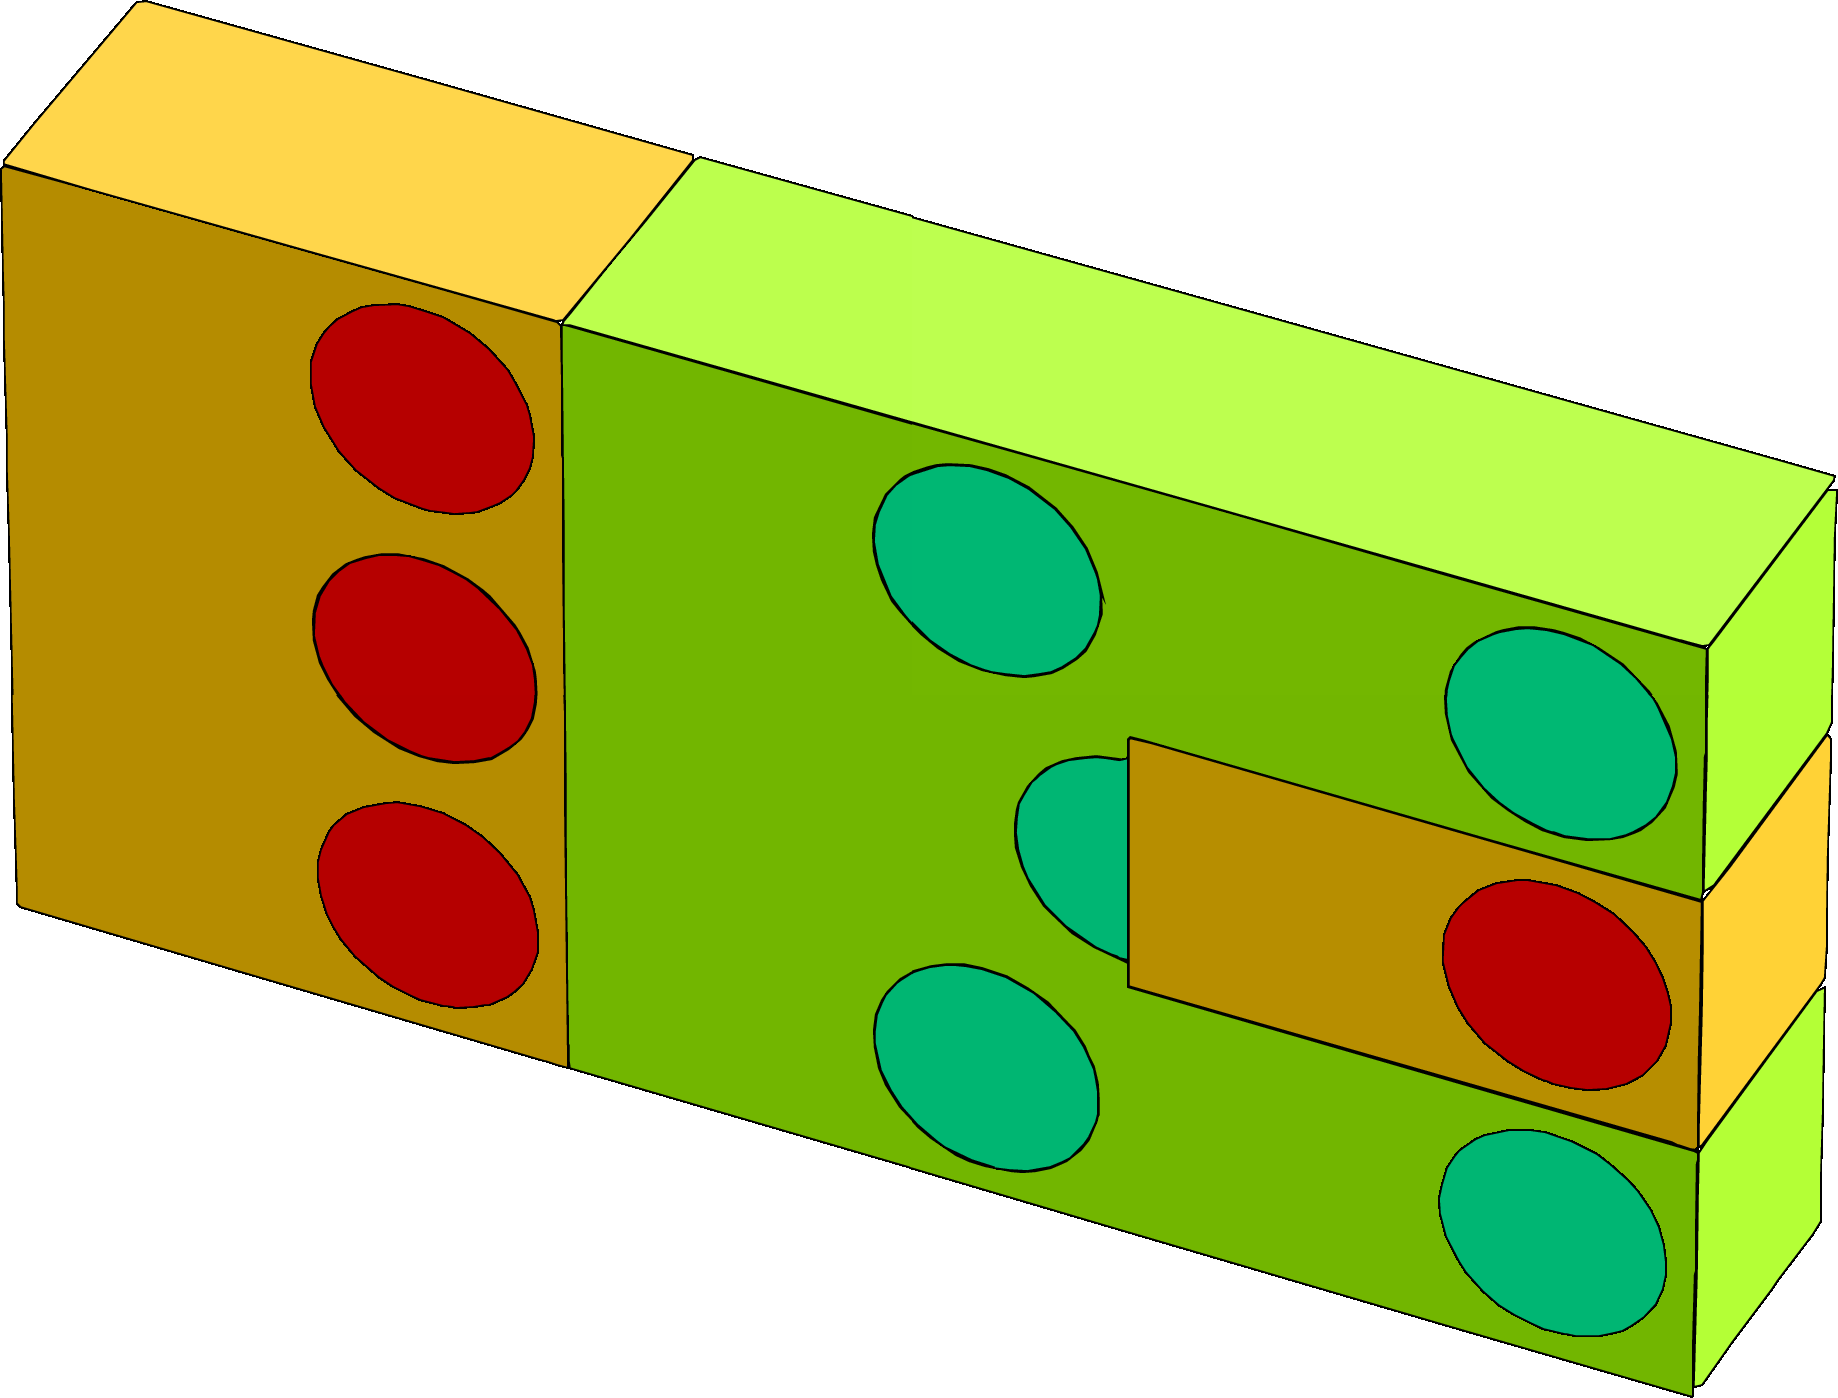
Fig. 7.22.3 Example output of [t-3dshow].
A region boundary can be added using option line=1 to produce the following box, which shows how the lattices are set up:
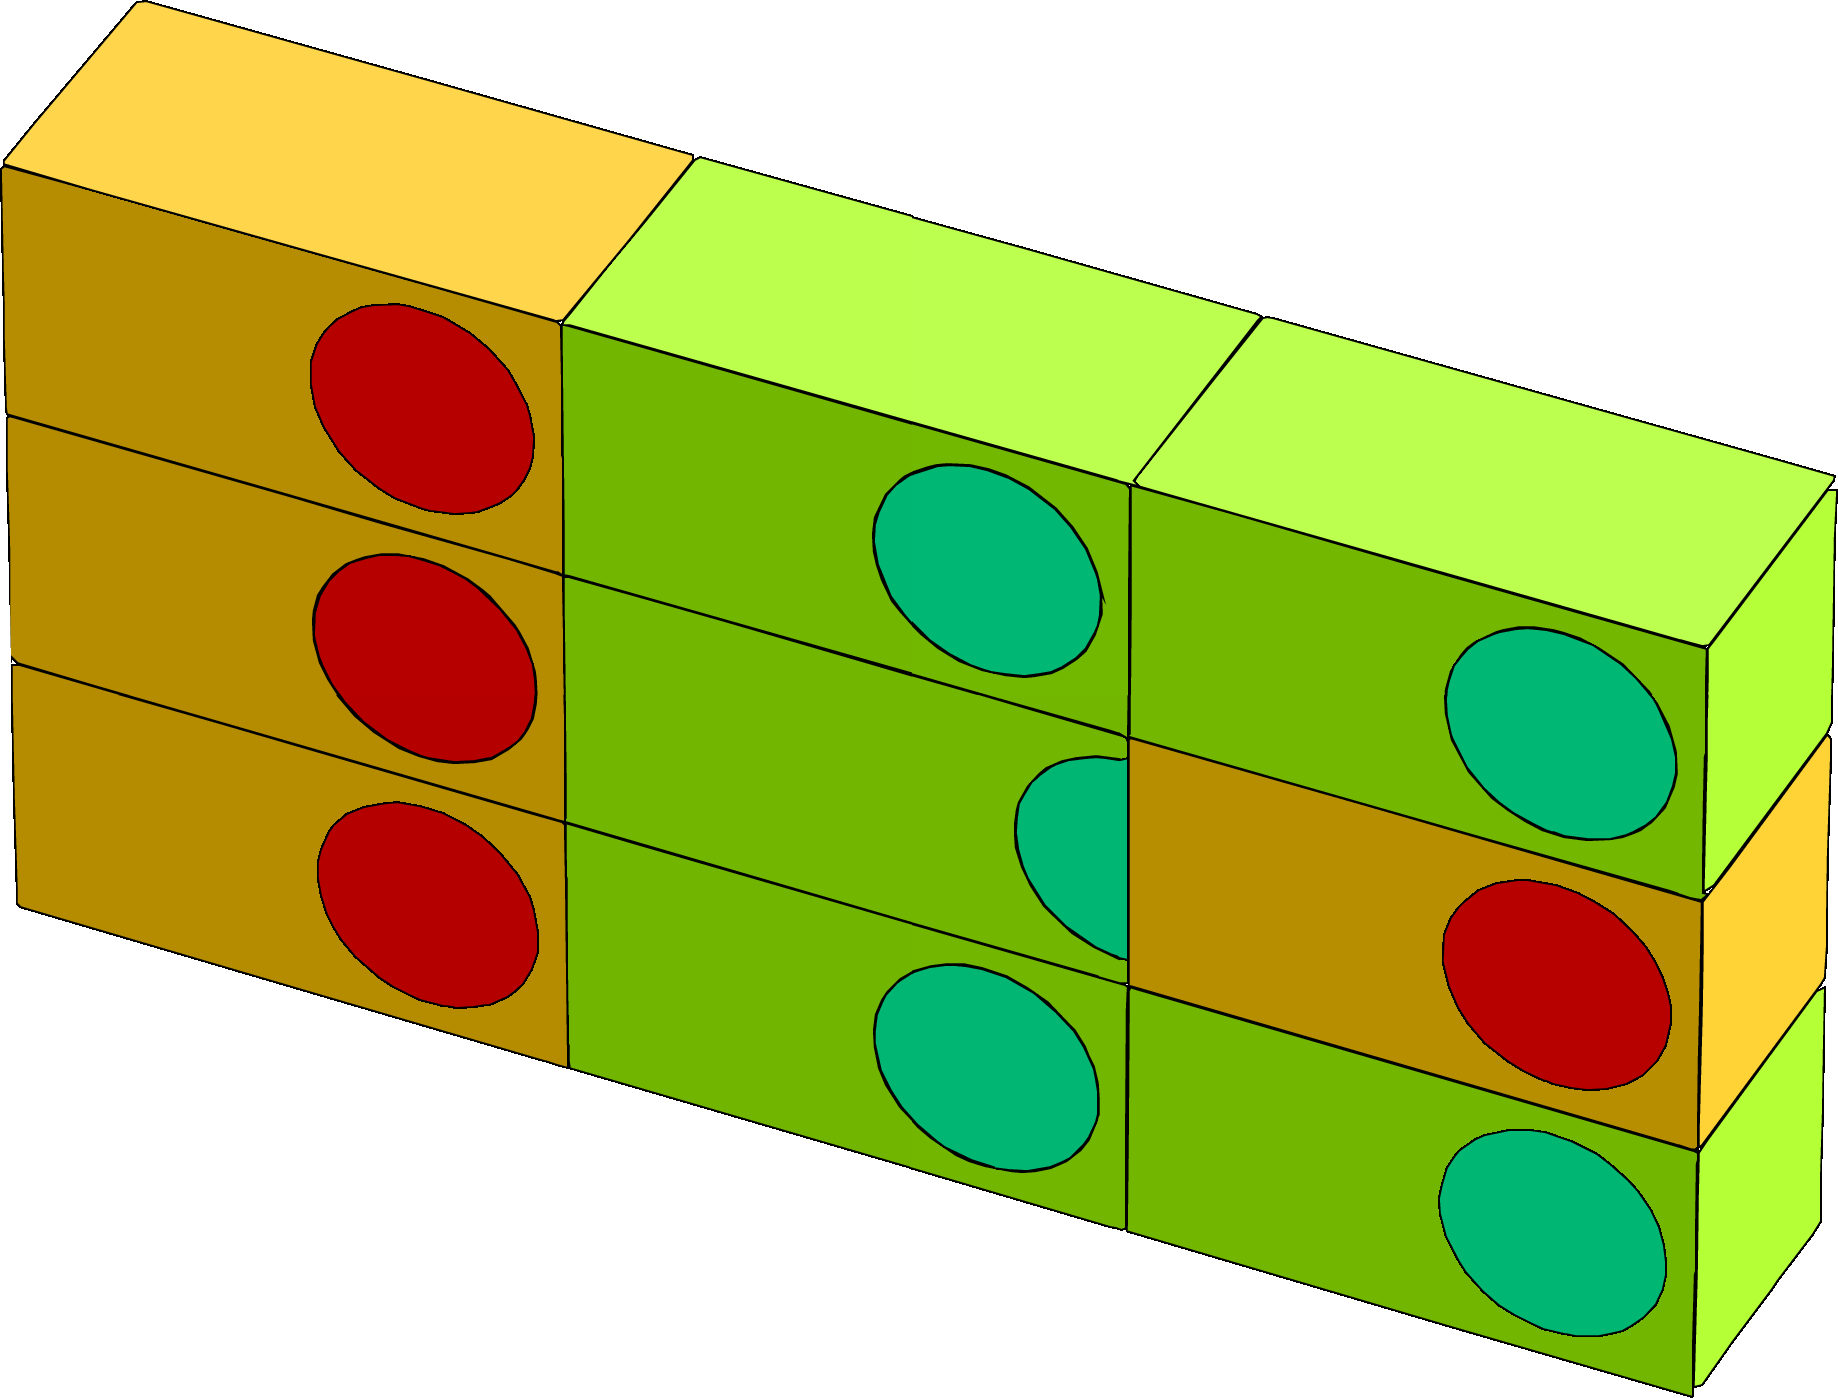
Fig. 7.22.4 Example output with line=1.
Setting material number 5 to be transparent and adding shadows using
      material = -1
                  5
        shadow =  2
produces the following box:
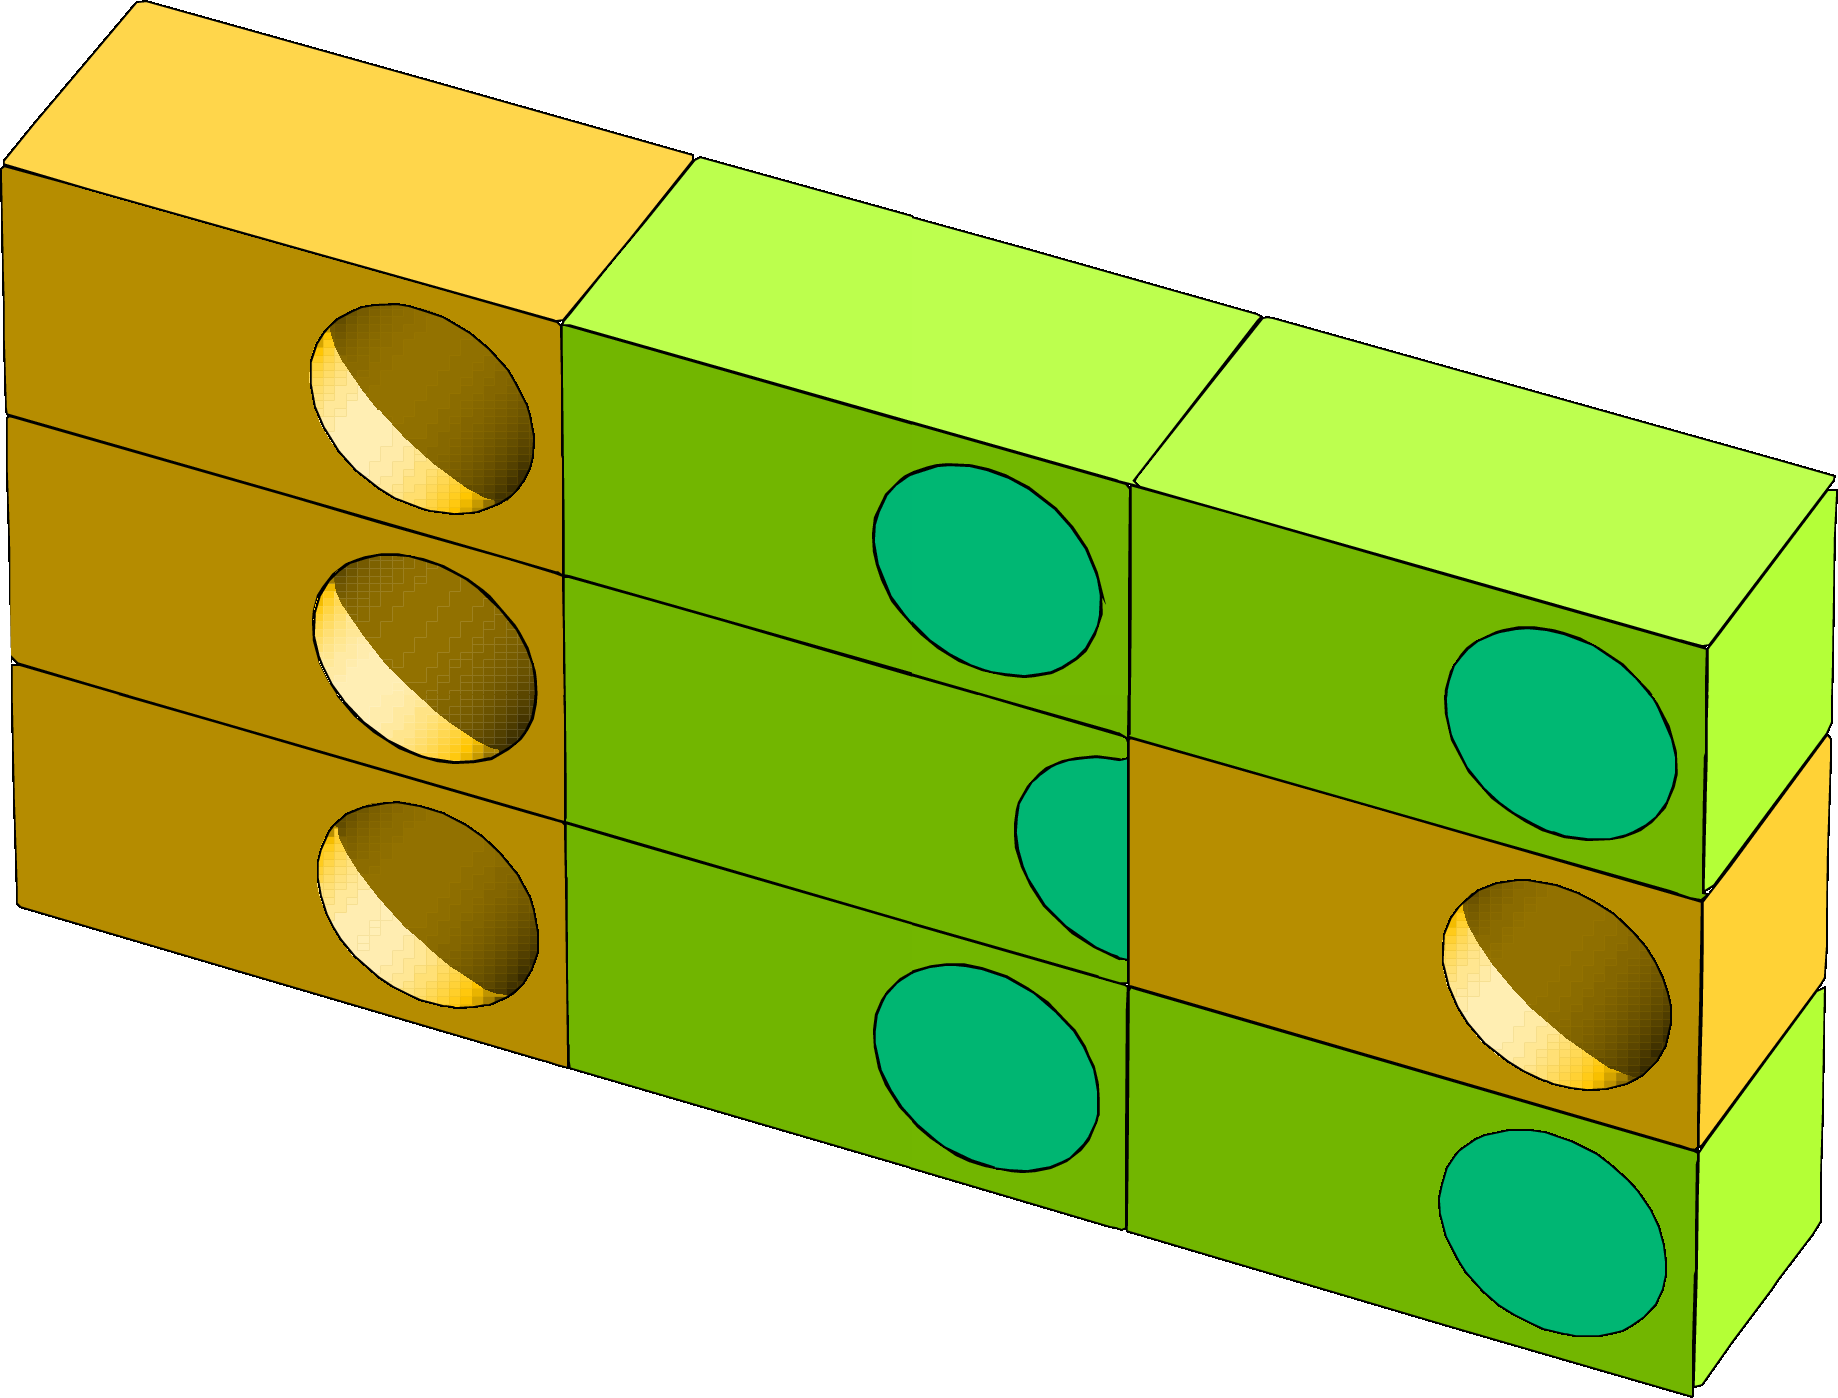
Fig. 7.22.5 Example output with transparent material and shadow.
Next, defining the following box:
      box = 1
      box    0  10  30
           100  10  30
             0  10  100 100
produces a transparent box that shows the inside of its body:
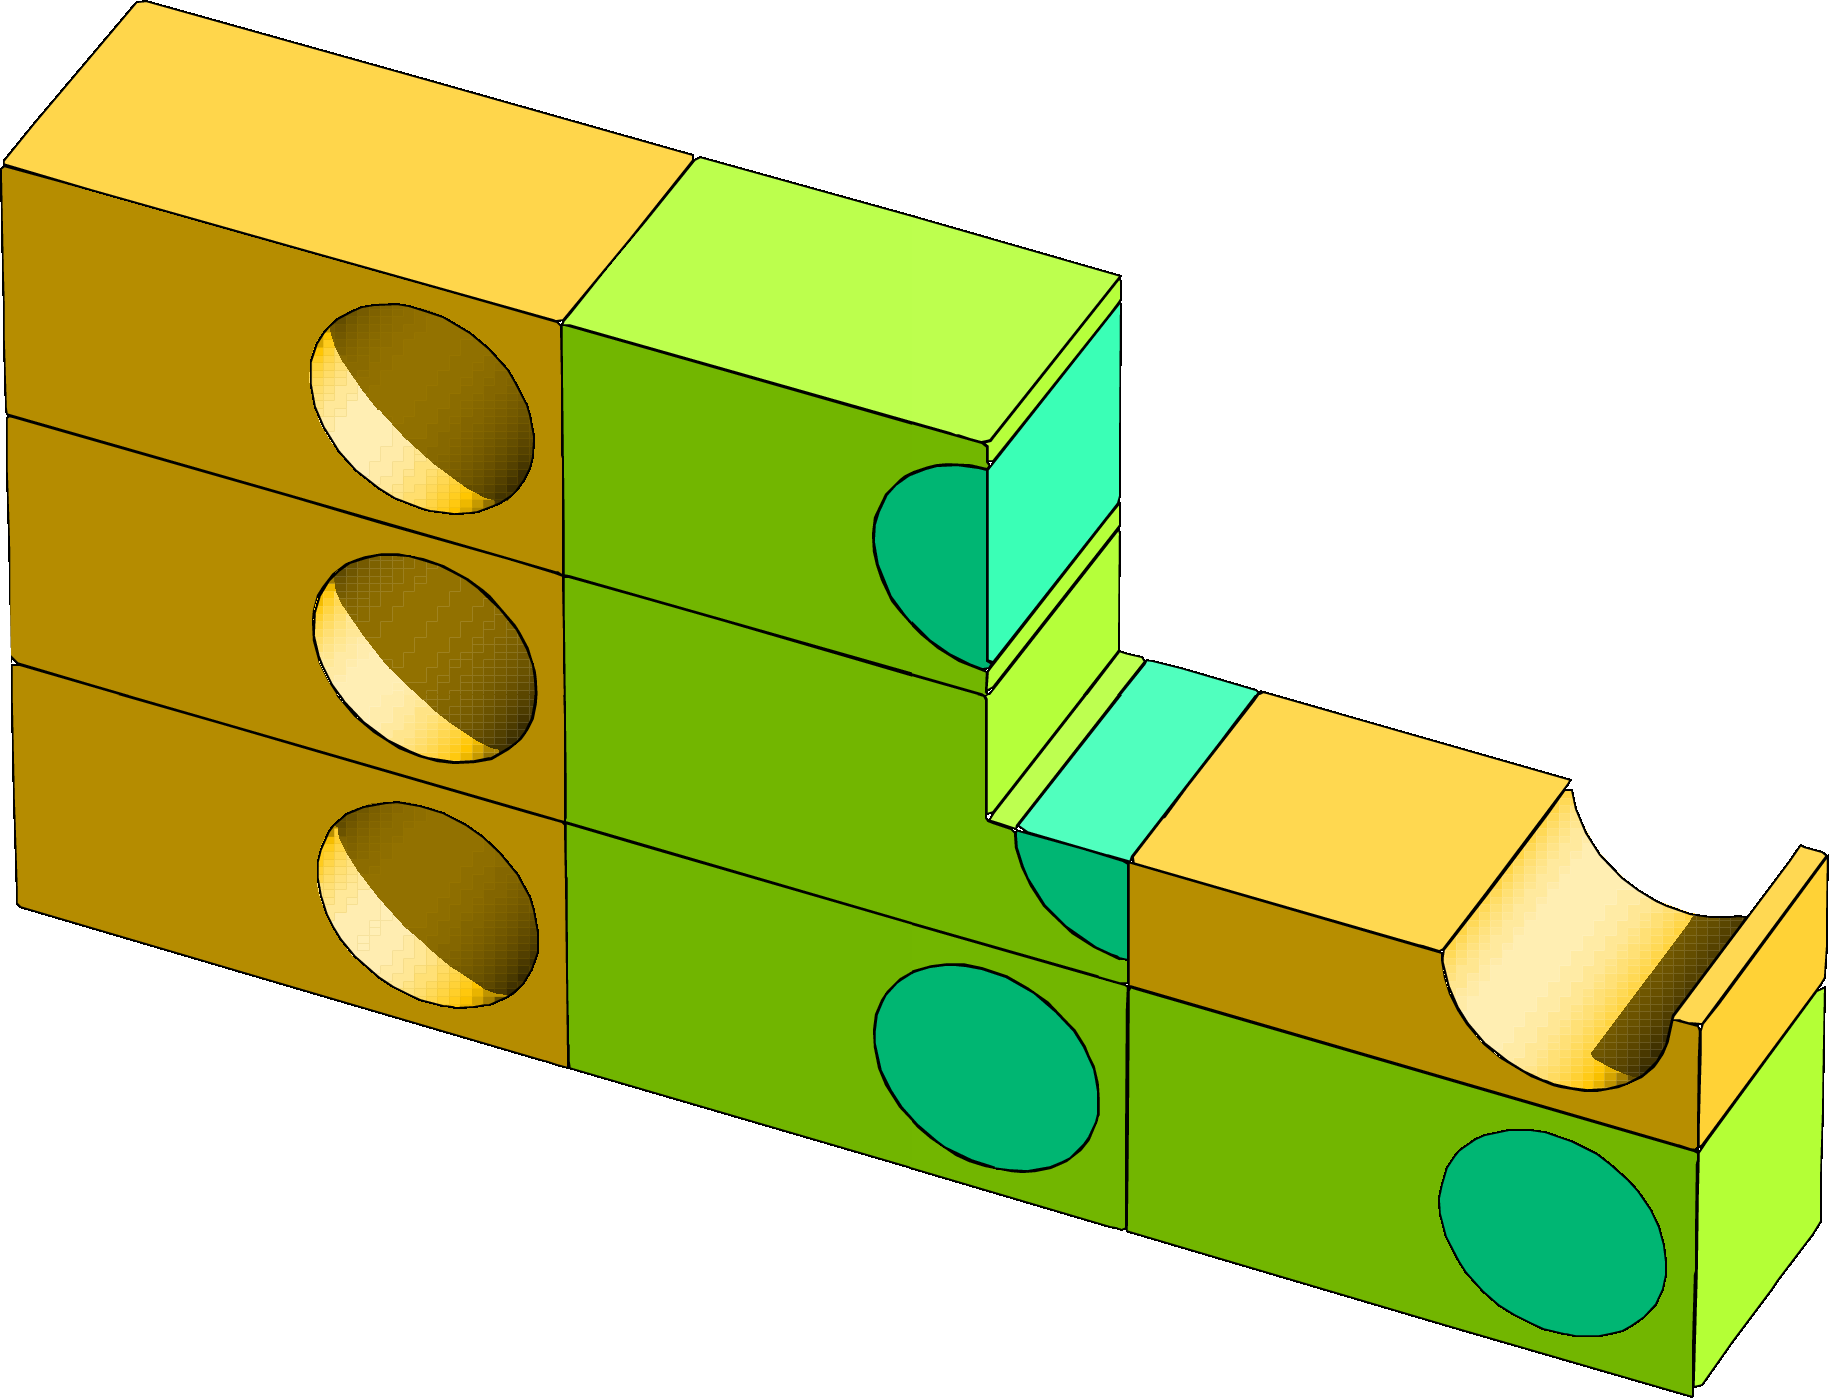
Fig. 7.22.6 Example output with a transparent box.
As a final example, by adding
      reg = ( 3 < 6[0 0 0] )
      matinbox = 1
                 6
the regions defined by reg = (3 < 6[0 0 0]) become transparent and material number 6 becomes visible:
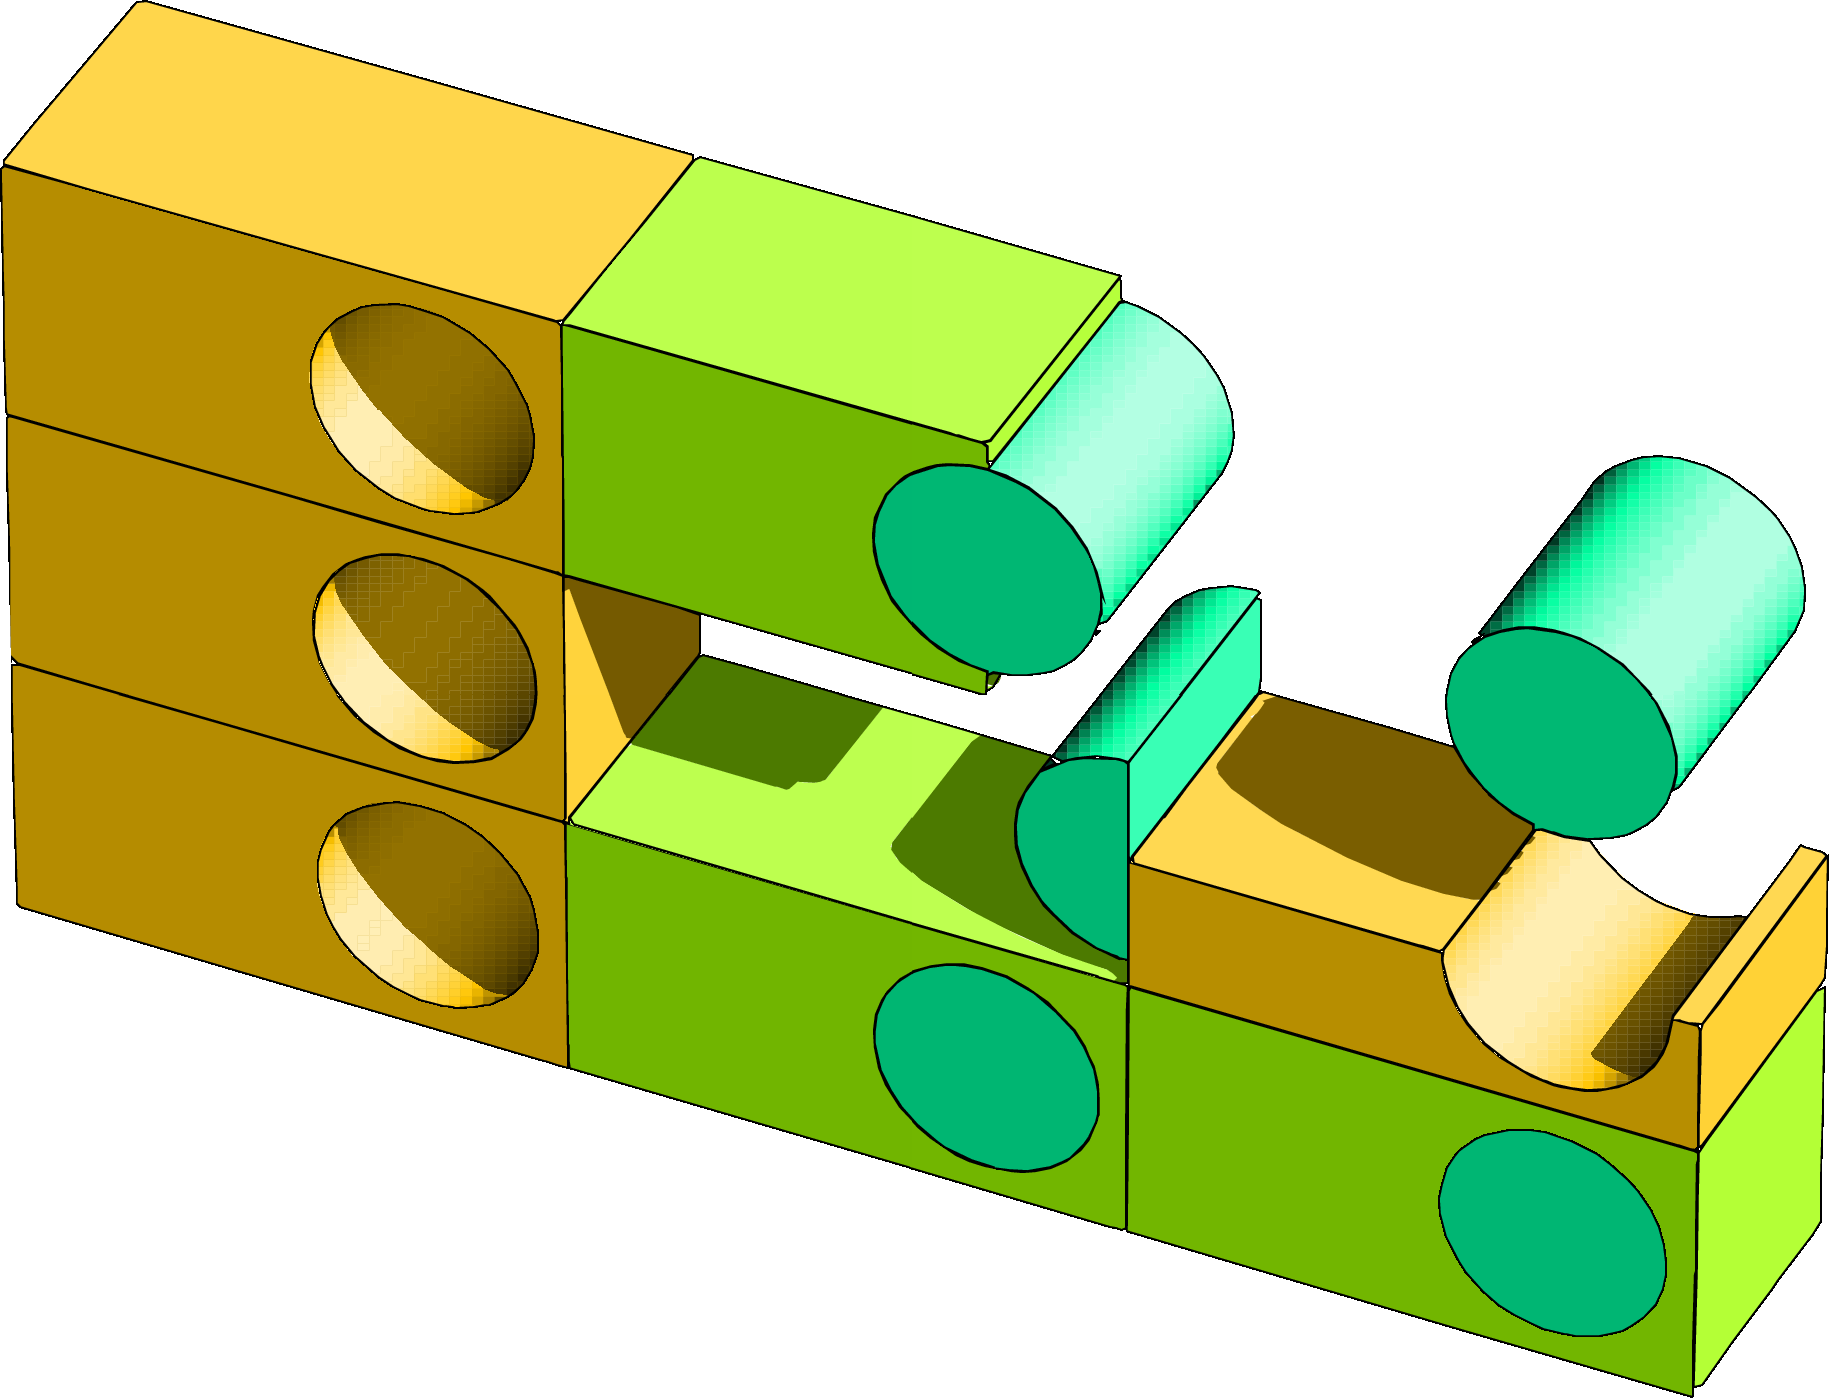
Fig. 7.22.7 Example output with transparent region and visible material.
Any number of complex structure types can be created by combining the above options.