3.3. Put a height legend in the color cluster plot
In the color cluster plot, the height is shown in color. One wants to know a legend of which color represents how high. Currently, ANGEL does not have the ability to create this automatically. So, here’s an input that briefly draws a height legend.
First, consider the following color cluster plot.
List 3.8 • Color cluster plot 1
 1:  p: nofr noms
 2:  x: z [cm]
 3:  y: y [cm]
 4:  set: c1[0.667] c2[0.900] c3[0.800]
 5:  p: form[c1] xfac[c2] afac[c3] nosp
 6:  set: c4[3.40E-06] c5[4.83E-01]
 7:  p: cmin[c4] cmax[c5]
 8:  p: zlog
 9:  p: xmin( -6.0 ) xmax( 6.0 )
10:  p: ymin( -4.0 ) ymax( 4.0 )
11:  hc: y = 3.9 to -3.9 by 0.2 ; x = -5.9 to 5.9 by 0.2 ;
12:  infl: {heat.dat}
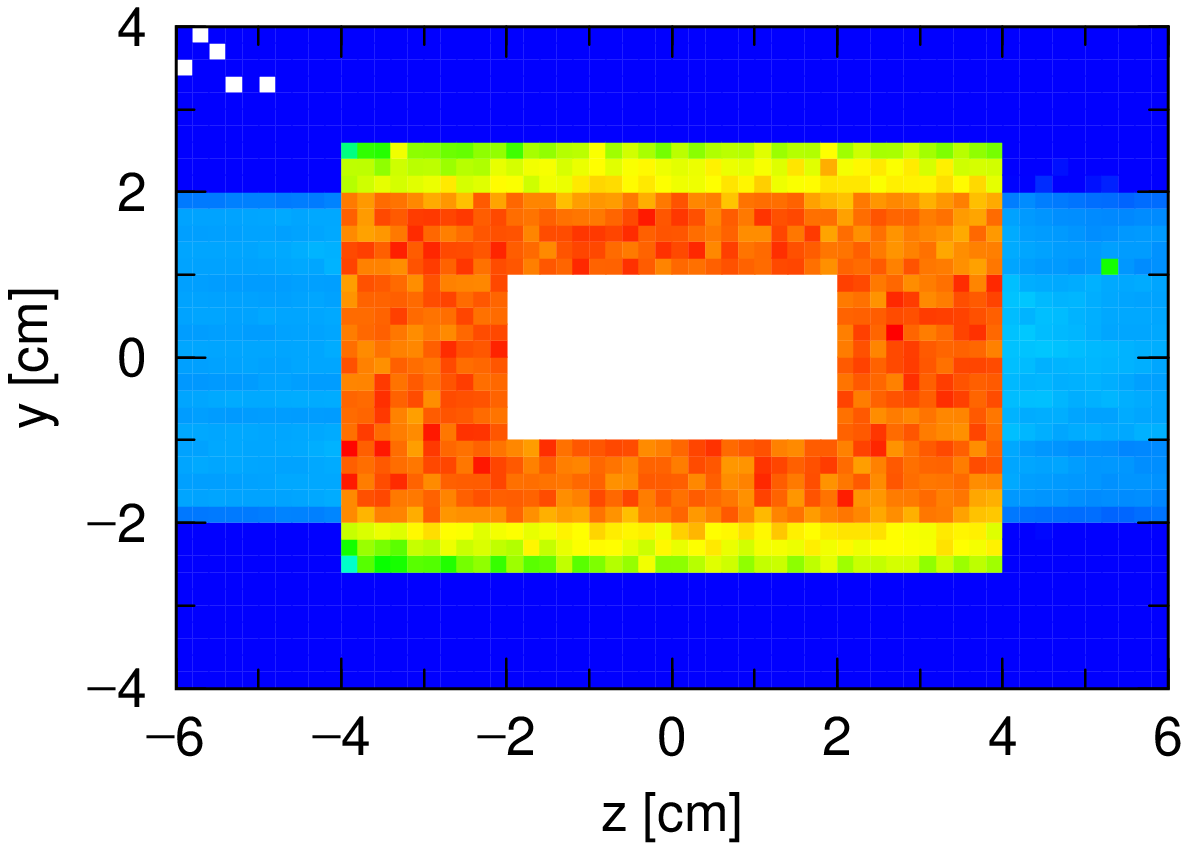
Fig. 3.13 Color cluster plot 1
Lines 4 and 6 define constants, which are denoted to use later. c1, c2, c3 is for the original graph form, xfac, afac and c4, c5 is for the values of minimal and maximal height. In this graph, the height is displayed in logarithm. To put a height legend in it:
List 3.9 • Color cluster plot 2
13:
14:  z: xorg(1.03)
15:  p: xfac[c2*0.05] form[c1/0.05] notn
16:  p: ymin(0) ymax(1) xmin(0) xmax(1) cmin(1) cmax(20) nosp
17:  hc: y= 0.025 to 0.975 by 0.05 ; x= 0.5 to 0.5 by 1 ;
18:   1  2  3  4  5  6  7  8  9 10 11 12 13 14 15 16 17 18 19 20
19:
20:  z: xorg(0.0)
21:  p: afac[c3*0.625] ymin[c4] ymax[c5] nosp ylog
22:  p: noxt noxn ytxt(-1) ynum(-1) xtic(0) itic(1)
23:  y: Heat [MeV/source]
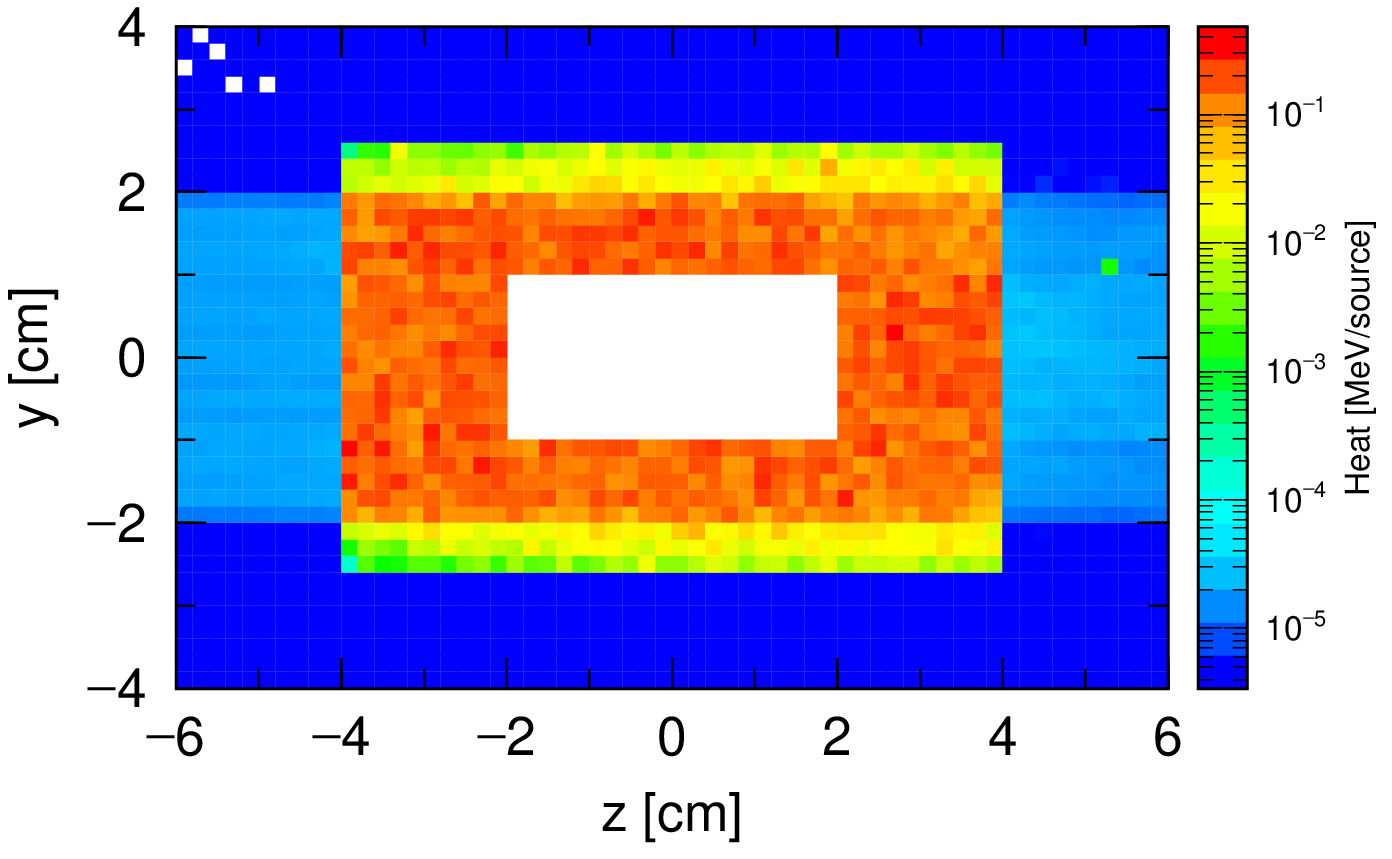
Fig. 3.14 Color cluster plot 2
Up to the 12th line is the same as before, so you can omit it. Line 14 defines a new graph. Lines 15-18 plot the color clusters used in the legend evenly divided into 20 from the minimum to the maximum. Increase this number if you want to smooth out the color changes in the legend. The 14th line xorg(1.03) is the positional relationship with the original graph. Also, 0.05 on the 15th line is the number that determines the width of the legend. Here, it is set as 5 % of the length of the original X-axis.
The 20th line further defines the following graph. This graph overlaps the exact previous color cluster plot. Here, the units of scale and height are written. 0.625 on the 21st line is the value of how many times the size of the number and title at this time is multiplied by those of the original graph. Here, it gets little smaller.