3.5. Display graphs of different scales at the same time
Sometimes you want to display multiple graphs with different X-axis or Y-axis scales in the same coordinate axis system. For example, if the X-axis is the same but the Y-axis values are significantly different, you want to draw the left Y-axis scale and the right Y-axis scale independently. ANGEL doesn’t provide an option to take independent values on the left and right axes, or the top and bottom axes, but it can be achieved by overlaying the two graphs. As an example, consider the following two graphs.
List 3.11 • Overlay graphs 1
 1:  p: scal(0.5) nofr noms
 2:  x: E (MeV)
 3:  y: Multiplicity
 4:  p: xmin(0) xmax(5.0) ymin(0) ymax(70) nosp
 5:  h: x       y,3l
 6:     0.5     10
 7:     1.5     40
 8:     2.5     20
 9:     3.5     60
10:     4.5     30
11:
12:  z: xorg(1.3)
13:  x: E (MeV)
14:  y: d\sigma/d\Omega dE (nb/MeV/sr)
15:  p: xmin(0) xmax(5.0) ymin(0) ymax(5) nosp
16:  h:  x     y1,d6   ny2   dy1=[y1*y2/100]
17:      0.0    0.0     0.0
18:      1.0    0.4    50.0
19:      2.0    1.5    30.0
20:      3.0    2.5    20.0
21:      4.0    4.1    10.0
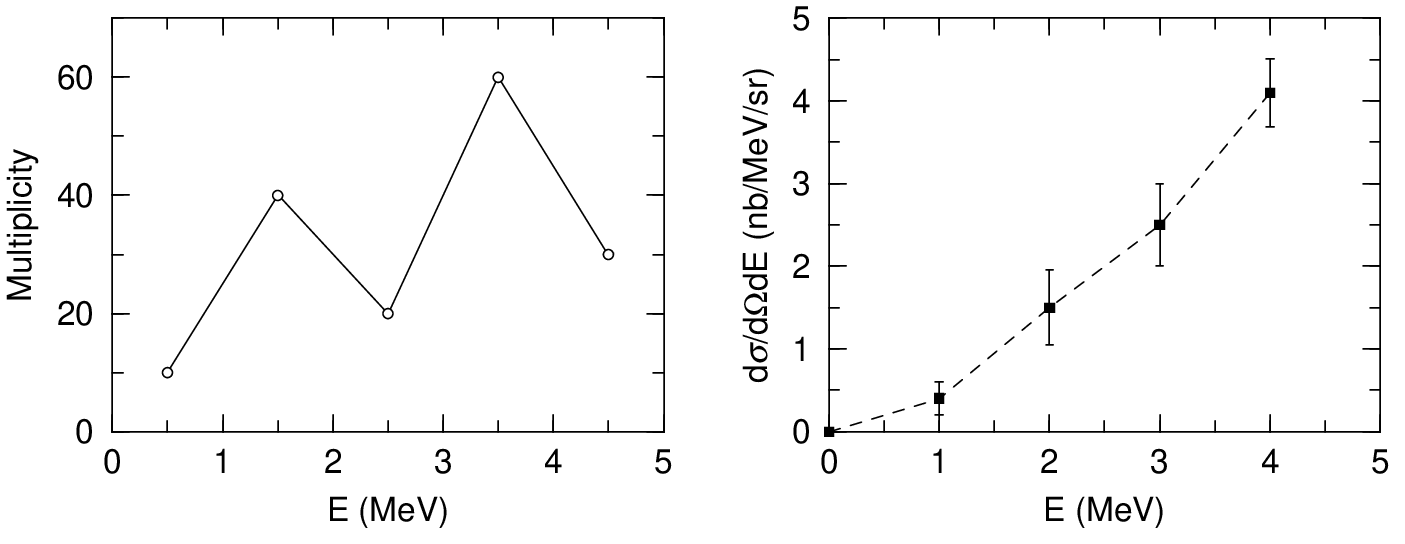
Fig. 3.16 Overlay graphs 1
These are two graphs arranged side by side using a multigraph section. To overlap the two, you can use xorg(0.0) on the 12th line, but the scale and title will overlap. So do the following:
List 3.12 • Overlay graphs 2
 1:  p: scal(0.5) nofr noms
 2:  p: ytic(1)
 3:  x: E (MeV)
 4:  y: Multiplicity
 5:  p: xmin(0) xmax(5.0) ymin(0) ymax(70) nosp
 6:  h: x       y,3l
 7:     0.5     10
 8:     1.5     40
 9:     2.5     20
10:     3.5     60
11:     4.5     30
12:
13:  z: xorg(0.0)
14:  p: ytxt(-1) ytic(-1) ynum(-1)
15:  x: E (MeV)
16:  y: d\sigma/d\Omega dE (nb/MeV/sr)
17:  p: xmin(0) xmax(5.0) ymin(0) ymax(5) nosp
18:  h:  x     y1,d6   ny2   dy1=[y1*y2/100]
19:      0.0    0.0     0.0
20:      1.0    0.4    50.0
21:      2.0    1.5    30.0
22:      3.0    2.5    20.0
23:      4.0    4.1    10.0
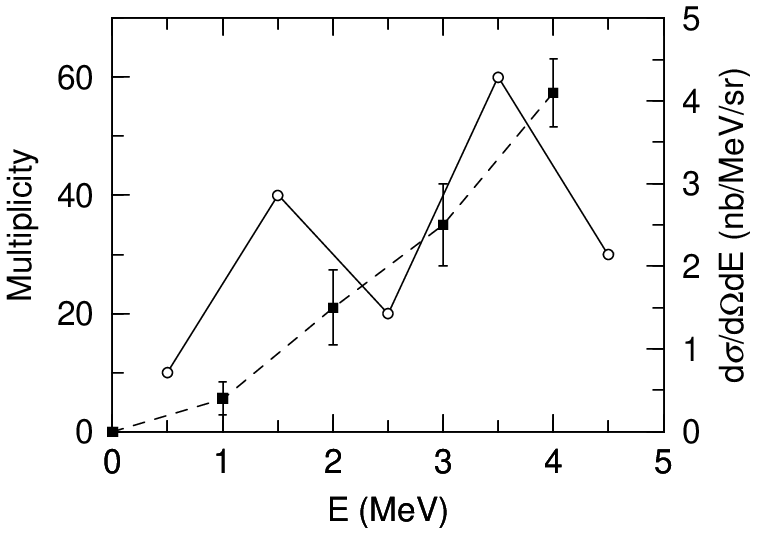
Fig. 3.17 Overlay graphs 2
First, turn off the right scale of the first graph on the second line. Next, on the 14th line, the Y title, Y-axis scale, and Y-axis scale numbers of the second graph are displayed only on the right side. This completes the simultaneous display of two axes with different scales.