1.3. Tutorial example 1
Let us start from the most popular case where we have a couple of data (x,y) type. When you want to plot one dimensional graph from (x,y) data by taking the first column as x-axis and the second one as y-axis, it is enough to insert one line of ANGEL command before the date as follows [1],
List 1.1 • Input of tutorial example 1
1:  H: X     Y            <-------- Insert
2:     0.5   10
3:     3     40
4:     5     20
5:     7     60
6:     9     30
The first line, “H: X Y”, is a command line of ANGEL which makes one dimensional plot according to the following lines which include two data, the first column is x data and the second one is y data. ANGEL processes this file and creates an EPS file, which is shown bellow, where the size of paper is A4 in default.
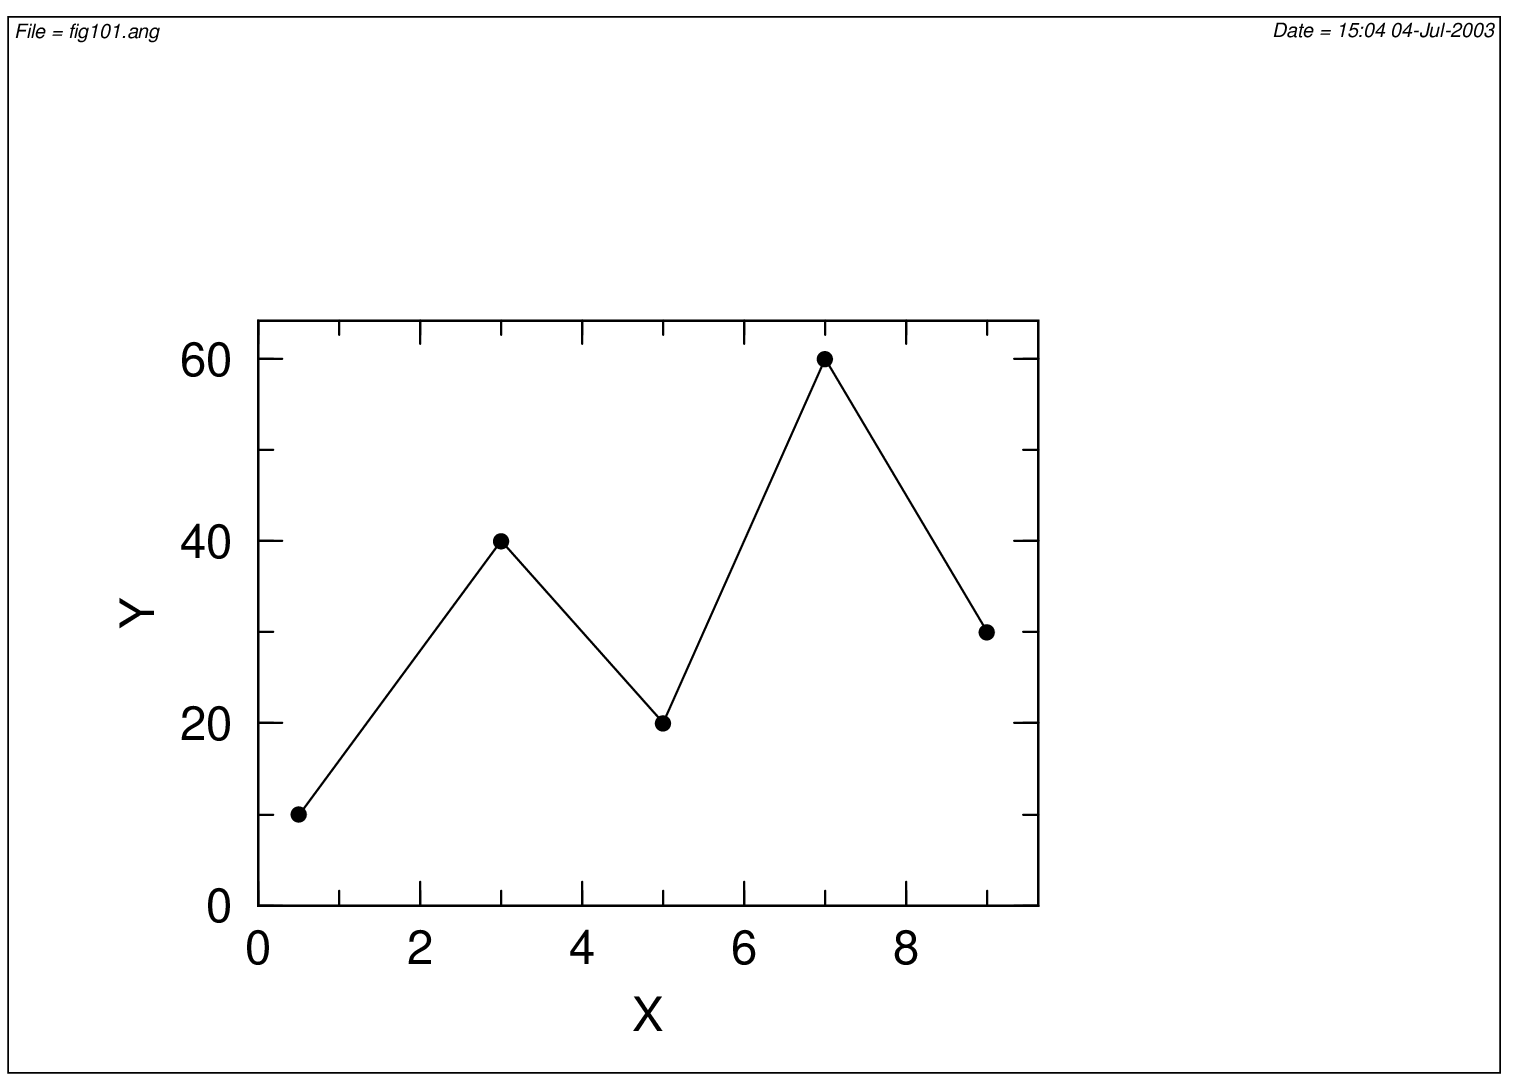
Fig. 1.1 Tutorial example 1
Only by List 1.1, you can get the above graph in which ANGEL automatically determines the scale of x and y axis, number, text and margin by the default.